ARCHIVED - Industry Canada
 This page has been archived.
Archived Content
Information identified as archived on the Web is for reference, research or recordkeeping purposes. It has not been altered or updated after the date of archiving. Web pages that are archived on the Web are not subject to the Government of Canada Web Standards. As per the Communications Policy of the Government of Canada, you can request alternate formats on the "Contact Us" page.
2008-09
Departmental Performance Report
Industry Canada
The original version was signed by
The Honourable Tony Clement
Minister of Industry
Section 1: Departmental Overview
1.1 Summary Information
1.2 Summary of Performance
Section 2: Analysis of Program Activities by Strategic Outcome
A Fair, Efficient and Competitive Marketplace
Strategic Policy Sector � Marketplace
Small Business and Marketplace Services and
Regional Operations Sector � Marketplace
Spectrum, Information Technologies and
Telecommunications Sector � Marketplace
Office of Consumer Affairs
Competition Bureau
Canadian Intellectual Property Office � Revolving
Fund
An Innovative Economy
Science and Innovation Sector � Science and Technology (S&T)
and Innovation
Industry Sector � S&T and Innovation
Spectrum, Information Technologies and Telecommunications Sector �
S&T and
Innovation
Communications Research Centre Canada
Industrial Technologies Office � Special Operating Agency
Competitive Industry and Sustainable Communities
Strategic Policy Sector � Economic Development
Small Business and Marketplace Services and Regional Operations Sector �
Economic Development
Industry Sector � Economic Development
Spectrum, Information Technologies and Telecommunications Sector �
Economic Development
Mackenzie Gas Project
Section 3: Supplementary Information
3.1 Financial Highlights
3.2 List of Tables
3.3 Other Items of Interest
IM/IT Governance and Responsibilities at Industry Canada
Section 41, Official Languages Act
3.4 Additional Information for Program Activities by Strategic Outcome
3.5 Expected Results Information for Program Sub-Activities and Sub-Sub-Activities by
Strategic Outcome
Minister�s Message
 The past year has been a challenging one for the Canadian economy, as it has been for the economies
of all industrialized countries. The global economic crisis put the fiscal and economic frameworks of all countries to the
test. But Canada entered the recession with solid fundamentals � balanced budgets, decreasing debt and taxes, a strong financial
sector and robust economic policies. Consequently, Canada is in a comparatively good position to effectively respond to
this time of economic challenge.
The past year has been a challenging one for the Canadian economy, as it has been for the economies
of all industrialized countries. The global economic crisis put the fiscal and economic frameworks of all countries to the
test. But Canada entered the recession with solid fundamentals � balanced budgets, decreasing debt and taxes, a strong financial
sector and robust economic policies. Consequently, Canada is in a comparatively good position to effectively respond to
this time of economic challenge.
The Industry Portfolio played a significant role in developing Canada�s resiliency and ability to weather the current crisis. Composed of Industry Canada and 10 other agencies, Crown corporations and quasi-judicial bodies, the Portfolio includes major instruments in the Government of Canada�s tool kit for building a competitive economy.
Industry Canada focuses on helping Canadians contribute to the knowledge economy and improving the country�s productivity and innovative capacity through three strategic outcomes:
- a fair, efficient and competitive marketplace;
- an innovative economy; and
- a competitive industry and sustainable communities.
To accomplish these outcomes, the Department focuses on developing effective marketplace framework policies and making strategic investments in key sectors to broaden Canada�s innovative capacity. In 2008�09, such measures included the following:
- an auction of radio spectrum for advanced wireless services, stimulating better service and more choices for businesses and consumers and resulting in more than $4 billion in bids for licences;
- amendments to the Competition Act and the Investment Canada Act in response to the Competition Policy Review Panel�s recommendations for a competitiveness agenda;
- a streamlined Canada Not-for-profit Corporations Act to eliminate unnecessary regulation and reduce red tape for not-for-profit corporations;
- strategic investments in science and technology initiatives, such as the Canada Excellence Research Chairs program and the Vanier Canada Graduate Scholarship program, and in major industries such as the automotive sector (through the Automotive Innovation Fund and a commitment to support long-term restructuring efforts) and the aerospace sector (through the Strategic Aerospace and Defence Initiative); and
- continued support for the Federal Economic Development Initiative for Northern Ontario to enable businesses and communities in the region to thrive.
In January 2009, the government introduced Canada�s Economic Action Plan, which contained stimulative measures to respond to the global recession. Industry Canada and its Portfolio members played, and will continue to play, a central role in developing and implementing a signficant number of these critical initiatives. These measures range from programs to upgrade research infrastructure at Canada�s universities and colleges, to helping small businesses bring innovative products to market, to supporting major tourism events, to enhancing community and recreational facilities and other municipal infrastructure in Ontario. For more information, visit the Canada�s Economic Action Plan website.
As a country, we are emerging from the recession by creating a climate that encourages innovation, productivity and competitiveness � helping Canadian industry move to the forefront of the global knowledge economy. Industry Canada, the Portfolio members, and other federal departments and agencies are working in partnership so that Canada continues to enjoy a high standard of living and a prosperous future.
It is my pleasure to present Industry Canada�s Departmental Performance Report for 2008�09.
Tony Clement
Minister of Industry
Section 1: Departmental Overview
1.1 Summary Information
Raison d��tre
- provides more and better-paying jobs for Canadians;
- supports stronger economic growth through continued improvements in productivity and innovation performance;
- gives businesses, consumers and investors confidence that the marketplace is fair, efficient and competitive; and
- integrates the economic, environmental and social interests of Canadians.
Responsibilities
The Minister of Industry is responsible for carrying out Industry Canada�s mandate and for advancing sustainable development through the Department and the Industry Portfolio. The Minister has jurisdiction over policy issues related to industry, trade and commerce; science; consumer affairs; corporations and corporate securities; competition and restraint of trade, including mergers and monopolies; bankruptcy and insolvency; intellectual property; telecommunications; investment; small businesses; and regional economic development across Canada.
The Deputy Minister and Senior Associate Deputy Minister are accountable for the stewardship of Industry Canada. They provide strategic direction and sound management to ensure that the Department contributes effectively to achieving the government�s priorities and that its wide range of activities is well coordinated and produces concrete results.
From an operational point of view, Industry Canada�s governance structure is functionally expressed through its committee structure at both the working and senior management levels, which support senior executives and ultimately the Minister. The committee structure is traditional in nature � divided between operations (Management Committee) and policy (Deputy Minister�s Policy Table). These committees provide oversight and decision-making authority in a number of areas including policy; IM/IT; and project management, procurement and contracting. They determine how allocation and reallocation decisions are made; and how programs are coordinated and managed to achieve the Department�s Strategic Outcomes communicated to Parliament.
Organizational Changes within Industry Canada
The Department�s organizational chart reflects a number of organizational changes that occurred in 2008�09 and that are outlined in further detail below. It is important to note that this year�s performance report does not reflect the revised organizational structure, but is instead based on the Department�s Program Activity Architecture (PAA) for 2008�09. Given the timing of the machinery of government changes outlined below, they were not reflected in the 2008�09 PAA and are therefore not shown in this year�s performance report.
Organizational Changes:
- Small Business and Marketplace Services and Regional Operations Sector: The previous Operations Sector was split into the Small Business and Marketplace Services Sector and Regional Operations Sector. The program activities were renamed to reflect this change for the 2008�09 PAA and repositioned in the 2009�10 PAA to reflect this change at the program activity level following a realignment of Industry Canada�s operational agenda.
- Technology Partnerships Canada: In February 2007, Technology Partnerships Canada (TPC) was replaced by the Industrial Technologies Office (ITO) within Industry Canada as the Special Operating Agency to manage both the Strategic Aerospace and Defence Initiative (SADI) and projects previously contracted through the TPC program.
- Genome Canada: Genome Canada was originally placed under the Program Activity Industry Sector � Science and Technology and Innovation, and was transferred to the Program Activity Science and Innovation Sector � Science and Technology in August 2006. In future PAAs, and in future Parliamentary reporting documents, Genome Canada, along with its Planned Spending and other financial information, will be under the Program Activity Science and Innovation Sector � Science and Technology and Innovation.
- The Automotive Innovation Fund (AIF): The AIF was approved by the Treasury Board Secretariat on June 11, 2008. The AIF was originally placed under the Strategic Outcome Competitive Industry and Sustainable Communities. In future PAAs, and in future Parliamentary reporting documents, the AIF, along with its Planned Spending and other financial information, will be under An Innovative Economy.
- The Perimeter Institute: The grant to the Perimeter Institute was originally mistakenly placed under the Program Activity Industry Sector � Science and Technology and Innovation. In future PAAs, and in future Parliamentary reporting documents, the grant, along with its Planned Spending and other financial information, will be under Science and Innovation Sector � Science and Technology and Innovation.
Machinery of Government Changes
In 2008�09 the following machinery of government changes impacted Industry Canada:
- Mackenzie Gas Project: The Mackenzie Gas Project (MGP) is a proposed 1,220-kilometre natural gas pipeline system through the Mackenzie Valley in the Northwest Territories that will connect northern onshore gas fields with North American markets. The project has the potential to make key contributions to Canada�s role as an energy superpower. The MGP was transferred from Indian and Northern Affairs Canada to Industry Canada late in 2007-08 and was subsequently transferred to Environment Canada on October 30, 2008. The PAA chart in this report does not reflect these transfers.
Strategic Outcomes
In order to effectively pursue its mandate, Industry Canada aims to achieve the following three strategic outcomes:
- A fair, efficient and competitive marketplace
- An innovative economy
- Competitive industry and sustainable communities
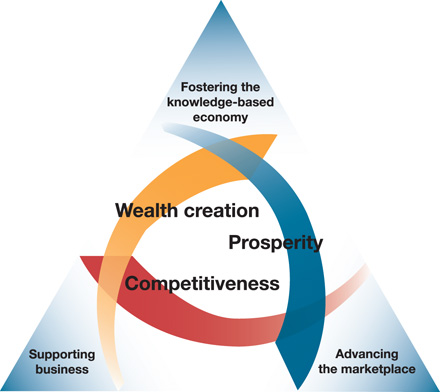
The many and varied activities Industry Canada carries out to deliver on its mandate are organized around three interdependent and mutually reinforcing strategic outcomes, each linked to a separate key strategy. The key strategies are shown in the illustration below:
 A fair, efficient and competitive
marketplace
A fair, efficient and competitive
marketplace
- By advancing the marketplace, we are developing and administering economic framework policies that promote innovation and competition and instill business, investor and consumer confidence.
An innovative economy
- By fostering the knowledge-based economy, we support foundational investments in science and technology to create new knowledge and equip Canadians with the skills and training they need to compete in the global knowledge-based economy.
Competitive industry and sustainable
communities
- By supporting business, we anchor and support business innovation and productivity, because businesses are the organizations that create wealth and generate jobs.
Industry Canada�s 2008�09 Program Activity Architecture
The chart below shows the full framework of Industry Canada�s Program Activities and Program Sub-Activities. These activities contribute to progress towards the Department�s three strategic outcomes for 2008�09.
Strategic Outcomes 2008�09 |
||
|---|---|---|
| A Fair, Efficient and Competitive Marketplace | An Innovative Economy | Competitive Industry and Sustainable Communities |
Program Activities |
||
| Strategic Policy Sector � Marketplace | Science and Innovation Sector � Science & Technology (S&T) and Innovation | Strategic Policy Sector � Economic Development |
Sub-Activities
|
Sub-Activities
|
Sub-Activities
|
Small Business and Marketplace Services and Regional Operations Sector � Marketplace |
Industry Sector � S&T and Innovation |
Small Business and Marketplace Services and Regional Operations Sector � Economic Development |
Sub-Activities
|
Sub-Activities
|
Sub-Activities
|
Spectrum, Information Technologies and Telecommunications Sector � Marketplace |
Spectrum, Information Technologies and Telecommunications Sector � S&T and Innovation |
Industry Sector � Economic Development |
Sub-Activities
|
Sub-Activities
|
Sub-Activities
|
| Office of Consumer Affairs | Communications Research Centre Canada | |
Sub-Activities
|
Sub-Activities
|
|
Competition Bureau |
Industrial Technologies Office � Special Operating Agency |
Spectrum, Information Technologies and Telecommunications Sector � Economic Development |
Sub-Activities
|
Sub-Activities
|
Sub-Activities
|
Canadian Intellectual Property Office � Revolving Fund |
||
| ($ millions) | 2006�07 Actual | 2007�08 Actual | 2008�09 | |||
|---|---|---|---|---|---|---|
| Main Estimates | Planned Spending | Total Authorities | Total Actuals** | |||
| A Fair, Efficient and Competitive Marketplace | ||||||
| Strategic Policy Sector � Marketplace | 6.2 | 10.7 | 12.6 | 12.6 | 18.2 | 18.1 |
| Small Business and Marketplace Services and Regional Operations Sector � Marketplace | 86.5 | 82.4 | 95.7 | 95.6 | 116.6 | 107.3 |
| Spectrum, Information Technologies and Telecommunications Sector � Marketplace | 67.0 | 58.7 | 59.0 | 58.9 | 68.2 | 65.0*** |
| Office of Consumer Affairs | 5.9 | 6.4 | 5.1 | 5.1 | 6.4 | 6.3 |
| Competition Bureau | 42.1 | 46.4 | 49.8 | 49.8 | 62.2 | 59.1 |
| Canadian Intellectual Property Office � Revolving Fund | (28.5) | (21.3) | 4.9 | 4.9 | 139.5 | (12.9) |
| Subtotal | 179.3 | 183.4 | 227.0 | 226.9 | 411.2 | 242.8 |
| An Innovative Economy | ||||||
| Science and Innovation Sector � Science & Technology (S&T) and Innovation | 10.6 | 148.8 | 94.0 | 101.1 | 100.0 | 99.7 |
| Industry Sector � S&T and Innovation | 4.9 | 19.4 | 9.5 | 9.5 | 101.0 | 90.4 |
| Spectrum, Information Technologies and Telecommunications Sector � S&T and Innovation | 24.1 | 15.1 | 27.4 | 18.4 | 30.2 | 29.5**** |
| Communications Research Centre Canada | 50.6 | 42.9 | 42.7 | 43.1 | 60.3 | 57.4� |
| Industrial Technologies Office � Special Operating Agency | 409.9 | 431.8 | 265.8 | 311.8 | 333.5 | 294.6 |
| Subtotal | 500.1 | 658.0 | 439.3 | 483.9 | 625.0 | 571.6 |
| Competitive Industry and Sustainable Communities | ||||||
| Strategic Policy Sector � Economic Development | 12.2 | 11.7 | 6.6 | 6.6 | 15.5 | 15.4 |
| Small Business and Marketplace Services and Regional Operations Sector � Economic Development | 352.8 | 292.2 | 225.6 | 235.6 | 315.4 | 272.3 |
| Industry Sector � Economic Development | 68.4 | 168.6 | 66.0 | 66.0 | 81.4 | 77.9 |
| Spectrum, Information Technologies and Telecommunications Sector � Economic Development | 76.9 | 50.1 | 8.0 | 26.1� | 43.7 | 43.6 |
| Mackenzie Gas Project | - | - | - | - | 7.9 | 5.0 |
| Subtotal | 510.3 | 522.6 | 306.2 | 334.2 | 464.0 | 414.2 |
| Budgetary Main Estimates | 1,189.6 | 1,363.9 | 972.5 | 1,045.0 | 1,500.1 | 1,228.6 |
| Non-Budgetary Main Estimates | - | - | 0.8 | 0.8 | 2.8 | - |
| Total | 1,189.6 | 1,363.9 | 973.3 | 1,045.8 | 1,502.9 | 1,228.6 |
| Less: Non-Respendable revenue� | (522.3) | (569.2) | N/A | (475.4) | N/A | (4,767.5) |
| Plus: Cost of services received without charge� | 84.8 | 84.5 | N/A | 83.4 | N/A | 87.1 |
| Net Cost of Department | 752.2 | 879.2 | 973.3 | 653.8 | 1,502.9 | (3,451.8) |
| Full-Time Equivalents | 5,521 | 5,392 | 5,719 | 5,341 | ||
* Minor differences are due to rounding.
** Internal Services spending is prorated across all program activities.
***The variance between Planned Spending and Actual Spending relates to the increased salary costs from collective agreements and retroactive pays, as well as internal funding reallocations towards program legislative and regulatory priorities relating to spectrum / telecommunciations management.
**** The $28-million payment is the third instalment of the $120-million conditional grant for CANARIE�s Advanced Network. The amount paid is based on CANARIE�s cash flow requirements, reported annually to the Minister before an instalment is issued.
� The variance is a result of increased salary costs from collective agreements, recapitalization of scientific equipment, increased respendable revenues from collaborative research agreements and campus operations activities, and spectrum monitoring support for the Vancouver 2010 Winter Games.
� No resources were reported in the RPP for the Community Access Program and the Computers for Schools program, as the program authorities were still pending at the time.
� Non-Respendable Revenue and services received without charge are not included in the Main Estimates or Total Authorities of the Department. In 2008�09, Industry Canada received funding for an auction sale in the amount of $4.3 billion, which is reported in total in the DPR and Public Accounts as revenue on a cash basis. From an accrual accounting perspective, this auction is considered as deferred revenues since the economic benefit will occur over 10 years.
1.2 Summary of Performance
| Strategic Outcome 1: A Fair, Efficient and Competitive Marketplace | ||||||
| Performance Indicators | Results | Trend | ||||
|---|---|---|---|---|---|---|
| Regulatory and administrative capacity | Canada placed the 6th-smallest administrative burden on start-ups amongst OECD countries in 2008 (up from the 8th-smallest burden in 2003)1 | Improving | ||||
| Program Activity | 2007�08 Actual Spending ($ millions) |
2008�09 ($ millions) | ||||
| Main Estimates | Planned Spending | Total Authorities | Actual Spending | Alignment to Government of Canada Outcomes | ||
| Strategic Policy Sector � Marketplace | 10.7 | 12.6 | 12.6 | 18.2 | 18.1 | A Fair and Secure Marketplace |
| Small Business and Marketplace Services and Regional Operations Sector � Marketplace | 82.4 | 95.7 | 95.6 | 116.6 | 107.3 | |
| Spectrum, Information Technologies and Telecommunications Sector � Marketplace | 58.7 | 59.0 | 58.9 | 68.2 | 65.0* | |
| Office of Consumer Affairs | 6.4 | 5.1 | 5.1 | 6.4 | 6.3 | |
| Competition Bureau | 46.4 | 49.8 | 49.8 | 62.2 | 59.1 | |
| Canadian Intellectual Property Office � Revolving Fund | (21.3) | 4.9 | 4.9 | 139.5 | (12.9) | |
* The variance between Planned Spending and Actual Spending relates to the increased salary costs from collective agreements and retroactive pays, as well as internal funding reallocations towards program legislative and regulatory priorities relating to spectrum / telecom management.
| Strategic Outcome 2: An Innovative Economy | ||||||
| Performance Indicators | Results | Trend | ||||
|---|---|---|---|---|---|---|
| Number of people in science and technology occupations as a share of total employment | 1.2 million in 2008, or 7% of total employment; an increase of 0.41 percentage points from 20042 | Improving | ||||
| Program Activity | 2007�08 Actual Spending ($ millions) | 2008�09 ($ millions) | ||||
| Main Estimates | Planned Spending | Total Authorities | Actual Spending | Alignment to Government of Canada Outcomes | ||
| Science and Innovation Sector � Science and Technology (S&T) and Innovation | 148.8 | 94.0 | 101.1 | 100.0 | 99.7 | Strong Economic Growth |
| Industry Sector � S&T and Innovation | 19.4 | 9.5 | 9.5 | 101.0 | 90.4 | |
| SITT Sector � S&T and Innovation | 15.1 | 27.4 | 18.4 | 30.2 | 29.5 | |
| Communications Research Centre Canada | 42.9 | 42.7 | 43.1 | 60.3 | 57.4* | |
| Industrial Technologies Office � Special Operations Agency | 431.8 | 265.8 | 311.8 | 333.5 | 294.6 | |
* The variance is a result of increased salary costs from collective agreements, recapitalization of scientific equipment, increased respendable revenues from collaborative research agreements and campus operation activities, and spectrum monitoring support for the Vancouver 2010 Winter Games.
| Strategic Outcome 3: Competitive Industry and Sustainable Communities | ||||||
| Performance Indicators | Results | Trend | ||||
| International ranking of Canada in the use of information and communications technologies | Canada ranks 19th out of 154 countries in terms of level of advancement in the use of information and communications technology (ICT), down from 9th in 20023 | Declining | ||||
| Program Activity | 2007�08 Actual Spending ($ millions) | 2008�09 ($ millions) | ||||
|---|---|---|---|---|---|---|
| Main Estimates | Planned Spending | Total Authorities | Actual Spending | Alignment to Government of Canada Outcomes | ||
| Strategic Policy Sector � Economic Development | 11.7 | 6.6 | 6.6 | 15.5 | 15.4 | Strong Economic Growth |
| Small Business and Marketplace Sector and Regional Operations Sector � Economic Development | 292.2 | 225.6 | 235.6 | 315.4 | 272.3 | |
| Industry Sector � Economic Development | 168.6 | 66.0 | 66.0 | 81.4 | 77.9 | |
| SITT Sector � Economic Development | 50.1 | 8.0 | 26.1* | 43.7 | 43.6 | |
| Mackenzie Gas Project | - | - | - | 7.9 | 5.0 | |
* No resources were reported in the RPP for the Community Access Program and the Computers for Schools program as the program authorities were still pending at the time.
Management Priorities
| Management Priority: Integration, Use and Reporting of Performance Information |
Type: Previous commitment |
Strategic Outcome(s): All strategic outcomes |
Status
|
||
| Management Priority: New recourse and disclosure process required under the Public Servants Disclosure Protection Act |
Type: Previous commitment |
Strategic Outcome(s): All strategic outcomes |
Status
|
||
| Management Priority: Corporate Performance Framework |
Type: Previous commitment |
Strategic Outcome(s): All strategic outcomes |
Status
|
||
| Management Priority: Integrated Risk Management |
Type: Previous commitment |
Strategic Outcome(s): All strategic outcomes |
Status
|
||
| Management Priority: Human Resources Modernization Initiatives |
Type: Previous commitment |
Strategic Outcome(s): All strategic outcomes |
Status
|
||
| Management Priority: Project Management Governance |
Type: Previous commitment |
Strategic Outcome(s): All strategic outcomes |
Status
|
||
| Management Priority: Integrated Human Resource and Business Planning |
Type: Previous commitment |
Strategic Outcome(s): All strategic outcomes |
Status
|
||
Risk Analysis
Industry Canada�s capacity to achieve its strategic outcomes depends on its ability to identify, manage and mitigate department-wide risks. In 2008�09, the Department continued to make progress in this area, advanced its Integrated Risk Management Framework, and used the standard approach and principles set out in the framework to update its Corporate Risk Profile (CRP). The CRP established a clear direction for managing risks at Industry Canada and presented an assessment of the Department�s risks based on government priorities, external and internal organizational context, current management practices, and available resources. It also identified the strategic risks that need to be managed (such as people management, recruitment, development and retention) to enable Industry Canada to achieve its mandate, strategic outcomes and the expected results of its program activities.
The Department depends on its workforce to adapt its organizational structure to new and shifting priorities. As such, our renewal initiative priorities are focusing on people, retaining existing expertise and recruiting new staff with the necessary competencies. Early identification and detection of potential vacancies for specific groups and levels, e.g., research, IT and engineers, could help mitigate these risks. For those specific groups, management training courses were utilized to increase the pool of qualified candidates for succession planning. A career path was also developed for junior engineers and Computer Systems Administration (CS) functional groups.
Nationally, the performance of Canadian industry sectors has been impacted not only by the economic crisis, but also by rapidly changing technology, increased demands and trade barriers in international markets, and the convergence of network technologies and multimedia services. Some sectors have rescheduled projects, reduced production and laid off employees. Industry Canada addressed the challenges undermining the performance of Canadian industries by identifying and analyzing specific issues and developing strategic partnerships with research and development (R&D) organizations and other stakeholders to mitigate barriers to commercializing technologically intensive goods and services.
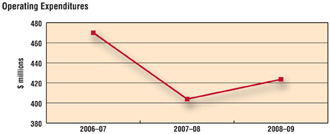
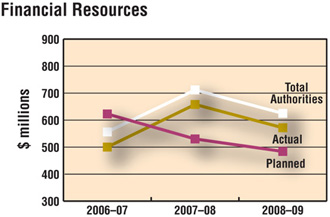
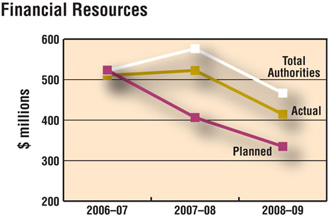
Expenditure Profile
Industry Canada�s total actual spending for 2008�09 was $1.23 billion. This represents a 9.5% decrease from 2007�08 actual spending, which was primarily due to variations in grants and contributions and other transfer payments, including a $105-million reduction related to the Seven Centres of Excellence for which funding was for one year only.
Industry Canada increased its operating budget from $403.9 million in 2007�08 to $423.5 million in 2008�09. This 4.85% increase helped the Department to deliver more benefits to Canadians and better contribute to its strategic outcomes.
 D
D
 D
D
Voted and Statutory Items
This table illustrates the way in which Parliament approved Industry Canada�s resources and shows the changes in resources derived from supplementary estimates and other authorities, as well as how funds were spent.
| Vote # or Statutory Item (S) |
Truncated Vote or Statutory Wording | 2008�09 ($ millions) | |||
| Main Estimates | Planned Spending | Total Authorities | Actual Spending | ||
| 1 | Operating Expenditures | 332.9 | 342.2 | 449.1 | 423.5 |
| 5 | Capital Expenditures | 12.6 | 13.0 | 21.9 | 17.7 |
| 10 | Grants and Contributions | 464.3 | 536.0 | 649.6 | 560.5 |
| (S) | Contributions to Employee Benefit Plans | 50.1 | 50.1 | 56.6 | 56.6 |
| (S) | Minister of Industry � Salary and Motor Car Allowance | 0.1 | 0.1 | 0.1 | 0.1 |
| (S) | Canadian Intellectual Property Office � Revolving Fund | 4.9 | 4.9 | 139.5 | (12.9) |
| (S) | Liabilities under the Small Business Loans Act | 2.1 | 2.1 | 0.6 | 0.6 |
| (S) | Liabilities under the Canada Small Business Financing Act | 81.7 | 81.7 | 110.3 | 110.3 |
| (S) | Grant to CANARIE Inc. (in connection with the Budget Implementation Act, 2007) | 24.0 | 15.0 | 28.0 | 28.0 |
| (S) | Grant to Perimeter Institute (in connection with the Budget Implementation Act, 2007) | - | - | 13.5 | 13.5 |
| (S) | Grant to Genome Canada | - | - | 29.5 | 29.5 |
| (S) | Spending of proceeds from the disposal of surplus Crown Assets | - | - | 0.6 | 0.3 |
| (S) | Refunds to amounts credited to revenues in previous years | - | - | 0.9 | 0.9 |
| Total Budgetary | 972.5 | 1,045.0 | 1,500.1 | 1,228.6 | |
|---|---|---|---|---|---|
| L15 | Payments pursuant to subsection 14(2) of the Department of Industry Act | 0.3 | 0.3 | 0.3 | - |
| L20 | Loan pursuant to paragraph 14(1)(a) of the Department of Industry Act | 0.5 | 0.5 | 0.5 | - |
| L97b | Advances to regional offices and employees posted abroad. Appropriation Act No. 1 1970. Limit $1,950,000 (net) | 2.0 | - | ||
| Total Non-Budgetary | 0.8 | 0.8 | 2.8 | - | |
| Total Department | 973.3 | 1,045.8 | 1,502.9 | 1,228.6 | |
Human Resources
| Human Resources 2008�09 | Planned | Actual | Difference |
| Full-Time Equivalents (FTEs) | 5,719 | 5,341 | 378 |
1 Indicators of Product Market Regulation. Organisation for Economic Co-operation and Development, 2008
2 Employment by Industry. Statistics Canada, 2009
3 Measuring the Information Society: The ICT Development Index. International Telecommunications Union, 2009, p.32
Section 2: Analysis of Program Activities by Strategic Outcome
Strategic Outcome: A Fair,
Efficient and Competitive Marketplace
| Performance Indicator | Results | Trend |
|---|---|---|
| Barriers to competition | Canada scored 5th-highest on the barriers to competition index among Organisation for Economic Co-operation and Development (OECD) countries in 2008 (higher scores indicating greater barriers), up from 11th-highest barriers in 20034 | Declining |
| Recent amendments to the Investment Canada Act have lowered obstacles to foreign investment in Canada. The most significant remaining barriers to competition and investment in Canada include barriers to foreign ownership, barriers to competition in network industries and barriers to competition in professional services5 | Improving | |
| Canada ranked 8th in the world in overall competitiveness in 2008, up from 10th in 20076 | Improving | |
| Regulatory and administrative capacity | Canada remains 2nd in the world on the number of days it takes to start a business (3.0 days)7 | No change |
| Canada placed the 6th-smallest administrative burden on start-ups amongst OECD countries in 2008, up from the 8th-smallest burden in 20038 | Improving | |
| Canada ranked 8th in the world on perceptions that its legal and regulatory framework encourages the competitiveness of enterprises, up from 11th in 20079 | Improving |
 D
DThe bidding process for the Advanced Wireless Services (AWS) spectrum auction opened on May 27, 2008, and closed on July 21, 2008. The auction follows a commitment made by the government to enable more competition in the wireless market. A total of 105 megahertz (MHz) of radio spectrum was opened for bidding, including 40 MHz of AWS spectrum for new entrants and another 65 MHz of spectrum for all bidders. The increased competition is designed to achieve lower prices, better service and more choice for consumers and businesses.
For more information: Spectrum Auctions
A fair, efficient and competitive marketplace helps create a business environment that encourages business competition and growth, thereby supporting overall economic growth and a higher standard of living for Canadians. Open and competitive markets also benefit consumers by encouraging improved choice and quality and lower prices for goods and services. In order to promote consumer confidence and more competitive and innovative businesses, Industry Canada will continue to provide the policies, regulations and administration to respond to the evolving marketplace.
 D
D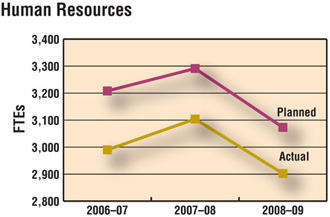 D
D
Meeting Our Commitments:
In an effort to contribute to a fair, efficient and competitive marketplace, 13 federal departments and agencies, including and led by Industry Canada, worked together to achieve the 20% reduction in the paperwork burden by streamlining regulations, eliminating duplicate requirements, getting rid of overlapping obligations and reducing how often documents need to be filed.
Benefits to Canadians:
- Created a dedicated response team and launched an interdepartmental policy development process in response to the Competition Policy Review Panel�s Compete to Win report from June 2008. This initiative will expand opportunities for Canadian firms, safeguard national security and enhance Canada�s competitive environment
- Protected consumers and promoted their interests by encouraging lower prices, better choices, and new products and services through amendments to the Competition Act and the Investment Canada Act. These amendments will also help Canada become more competitive globally by making Canada more attractive to foreign investments. This helps to create jobs and opportunities for Canadians and to improve productivity and innovation. They will also ensure that foreign investments do not jeopardize national security
- Along with many other technical standards put in place to enable new wireless technologies and services for Canadians, the Department enabled the introduction of digital television across Canada through the Digital TV Post-Transition Allotment Plan and the Post-transition Agreement on DTV between Canada and U.S.A.
- Provided access to essential telecommunications services to facilitate the communication between emergency responders, and continued to ensure that telecommunications services are available to Canadians during times of emergency
- Accelerated Canada�s economic development by encouraging inventors and innovators to maximize the value of their intellectual property (IP), based on their use of the intellectual property system and exploitation of IP information
In May 2008, following national media attention regarding gas pump measurement accuracy, the Minister of Industry instructed Measurement Canada to immediately undertake increased inspections of gas pumps. In response, 35,269 gas pump inspections were performed in 2008�09 � double the number of inspections performed in 2007�08. This approach, coupled with the introduction of more stringent enforcement strategies and follow-up inspections of inaccurately measuring gas pumps, resulted in the increased detection and correction of inaccurate measurement and improved consumer protection. Measurement Canada will continue to maintain a strong presence in the retail petroleum sector by responding to all complaints; performing targeted inspections where problems are known or suspected; ensuring retailers understand their legal obligations concerning gas pump measurement accuracy; and implementing increased enforcement and compliance strategies to improve consumer measurement accuracy in the marketplace.
Performance Analysis:
Through the following program activities, Industry Canada continued to build a fair, efficient and competitive marketplace.
Strategic Policy Sector � Marketplace
| Expected Result: Development and coordination of economic policy frameworks that support a fair, efficient and competitive marketplace | ||
|---|---|---|
| Performance Indicator | Results | Trend |
Number of policy initiatives, including legislative and regulatory amendments tabled and approved, aimed at supporting a fair, efficient and competitive marketplace in Canada (e.g. corporate, insolvency, intellectual property, investment, international trade and competition policy) |
|
Not Applicable* |
* Trends in performance indicators are not useful to measure due to the nature of the work of this program activity, where actual results vary from year to year, depending on the current agenda and priorities of the government. Recognizing the inherent difficulties in measuring the performance of the program activity, Public Policy Services has been moved under Internal Services in the 2009�10 PAA.
| Financial Resources ($ millions) 2008�09 | Human Resources (Full-Time Equivalents) 2008�09 | |||||
|---|---|---|---|---|---|---|
| Planned Spending | Total Authorities | Actual Spending | Planned | Actual | Difference | |
| 12.6 | 18.2 | 18.1* | 113 | 117 | 4 | |
* The variance can be explained by the transfer of funds for new responsibilities.
Meeting Our Commitments:
In support of a fair, efficient and competitive marketplace, and in response to the Competition Policy Review Panel�s recommendations, Industry Canada amended the Competition Act and the Investment Canada Act contained in the Budget Implementation Act, 2009, Bill C-10, which received Royal Assent on March 12, 2009. As set out in its report, Compete to Win, these amendments respond to the Panel�s core recommendations for modernizing Canada�s competition and foreign investment laws and policies, and better protecting consumers and promoting their interests by encouraging lower prices, better choices, and new products and services. Bill C-10 will also make Canada more competitive globally by creating jobs and opportunities for Canadians, attracting investment, improving productivity and innovation, and safeguarding Canada�s national security interests.
Small Business and Marketplace Services and Regional Operations Sector � Marketplace
| Expected Result: Marketplace fairness, integrity and efficiency are protected through regulation and promotion in the areas of insolvency, weights and measures, federal incorporation, and spectrum management | ||
|---|---|---|
| Performance Indicator | Results | Trend |
| Number of rules and requirements that are updated or reviewed to ensure relevance and responsiveness to marketplace needs |
|
New indicator |
| Financial Resources ($ millions) 2008�09 | Human Resources (Full-Time Equivalents) 2008�09 | |||||
|---|---|---|---|---|---|---|
| Planned Spending | Total Authorities | Actual Spending | Planned | Actual | Difference | |
| 95.6 | 116.6 | 107.3 | 1,098 | 1,044 | -54 | |
Meeting Our Commitments:
In 2008�09, Industry Canada conducted in-depth consultations in the chemical products, food and beverage manufacturing, livestock and poultry, and fruit and vegetable sectors to obtain stakeholder views and recommendations on how measurement accuracy should be achieved and monitored in these marketplace sectors. Through the establishment of sector-specific marketplace approaches to achieving and monitoring measurement accuracy, stakeholder needs and expectations were addressed and a suitable level of government intervention was afforded, contributing to a fair, efficient and competitive marketplace. Other consultations were also held to improve incorporation service across the country through interjurisdictional partnership, witnessed through the active participation of partners, including provinces and territories, in developing and formulating the new NUANS� governance structure.
To ensure marketplace fairness and efficiency in spectrum management, the new Radiocommunication and Broadcasting Antenna Systems procedures were published in January 2008. They came into effect in July 2008, after a six-month transition period, to allow the thousands of stakeholders across Canada, industry, government and the public, time to adapt to the updated process. The key changes include one process for all antenna structure usages, clearer processes for public notification and consultation, and added community involvement.
Spectrum, Information Technologies and Telecommunications Sector � Marketplace
| Expected Result: Canada�s radiocommunications and telecommunications infrastructure and online economy are governed by a modern and appropriate policy framework | ||
|---|---|---|
| Performance Indicator | Results | Trend |
| Percentage of policies, legislation and regulations developed, updated or reviewed as identified in annual branch business plans / strategic plans | 90% of planned initiatives were undertaken including:
|
New indicator |
| Financial Resources ($ millions) 2008�09 | Human Resources (Full-Time Equivalents) 2008�09 | |||||
|---|---|---|---|---|---|---|
| Planned Spending | Total Authorities | Actual Spending | Planned | Actual | Difference | |
| 58.9 | 68.2 | 65.0* | 357 | 337 | -20 | |
* The variance between Planned Spending and Actual Spending relates to the increased salary costs from collective agreements and retroactive pays, as well as internal funding reallocations towards program legislative and regulatory priorities relating to spectrum / telecom management.
Meeting Our Commitments:
Industry Canada has made significant progress in advancing Canada�s radiocommunications and telecommunications frameworks, which includes infrastructure, spectrum management and policy. In addition to raising $226.6 million annually in spectrum and radio licences, the Department held the Advanced Wireless Services (AWS) spectrum auction in 2008, which concluded successfully and raised over $4 billion. This spectrum is to be used for advanced wireless services such as high-speed Internet and mobile devices.
The Department also completed the Digital TV Post-Transition Allotment Plan, which reserves a part of the current television spectrum for digital television use and allows other services to use the remainder. The Allotment Plan provides a channel for each television station. This plan has been coordinated with the U.S. plan. The transition to digital television is set to be completed by August 31, 2011.
Industry Canada ensured that spectrum and telecommunications are available for public safety and emergency purposes. This includes readiness exercises for the Vancouver 2010 Winter Games, maintaining partnerships with stakeholders in both the private and public sectors, and completing the initial phase of a study on the resilience of the Canadian wireless infrastructure. In addition, various operational drills were executed to ensure equipment and government-related procedures were understood and effective in responding to a crisis.
Office of Consumer Affairs
| Expected Result: Consumer interests are protected and promoted throughout Canada | ||
|---|---|---|
| Performance Indicator | Results | Trend |
| Number of major challenges being addressed and/or documented that affect the consumer interest in Canada | 4 consumer challenges (consumer debt, consumer literacy, use of alternative forms of credit and the risk of identity theft) were continually addressed through research, advocacy and outreach | New indicator |
| Financial Resources ($ millions) 2008�09 | Human Resources (Full-Time Equivalents) 2008�09 | |||||
|---|---|---|---|---|---|---|
| Planned Spending | Total Authorities | Actual Spending | Planned | Actual | Difference | |
| 5.1 | 6.4 | 6.3* | 23 | 22 | -1 | |
* The variance can be explained by the fact that the Office of Consumer Affairs received further funding through supplementary estimates A and B.
Meeting Our Commitments:
Industry Canada, through the Office of Consumer Affairs (OCA), completed submissions concerning federal designation orders under the Criminal Code payday lending exemption for the province of Manitoba (order proposed in May 2008 and made official in June 2008) and for the province of Nova Scotia (order proposed in March 2009). In 2008�09, the OCA led the development of a joint federal-provincial-territorial discussion paper on services to help consumers recover from identity (ID) theft. To promote consumer confidence and address major consumer challenges, the Department also undertook research focusing on consumer vulnerability, the electronic marketplace and sustainable consumption. Evidence-based submissions were made to internal, interdepartmental and intergovernmental forums in support of modern frameworks for electronic payments, consumer credit reporting, financial literacy and telecommunications. Consumers were provided with a new information product on digital television, and an information series of five topics including debt and identity theft was completed for Canadians with low literacy skills. The OCA also released the 2008�09 version of The Canadian Consumer Handbook.
Competition Bureau
| Expected Result: The Canadian economy is efficient and adaptable due to the competitiveness of prices and choices available to consumers | ||
|---|---|---|
| Performance Indicator | Results | Trend |
| Dollar savings to consumers from Bureau actions that stop anti-competitive activity | Estimated savings of $254 million (criminal enforcement only)* | New Indicator |
* Estimated overcharge to consumers (or economic harm) for the duration of the infraction, prior to Bureau actions concluded in fiscal year 2008�09. This is a conservative estimate based on similar methodologies used by antitrust agencies in other countries.
| Financial Resources ($ millions) 2008�09 | Human Resources (Full-Time Equivalents) 2008�09 | |||||
|---|---|---|---|---|---|---|
| Planned Spending | Total Authorities | Actual Spending | Planned | Actual | Difference | |
| 49.8 | 62.2 | 59.1 | 452 | 438 | -14 | |
Meeting Our Commitments:
Combatting domestic cartels and illegal bid-rigging agreements was a priority for the Competition Bureau in fiscal year 2008�09, and key to ensuring that the Canadian marketplace is fair and competitive. Industry Canada, through the Competition Bureau, uncovered a conspiracy to fix the price of gasoline at the pump in the province of Quebec. As a result of that investigation, 13 individuals and 11 companies were charged. As of March 2009, 6 companies and 8 individuals had pled guilty, fines totalled over $2.6 million and imprisonment terms totalled 44 months.
Charges were laid against 14 individuals and 7 companies accused of rigging bids in order to obtain Government of Canada IT services contracts worth approximately $67 million. In addition, the Bureau continued to support prevention and detection by educating buyers and sellers to identify and report potential bid-rigging schemes. It conducted 51 bid-rigging presentations for approximately 2,020 people representing businesses across the country and all levels of government. Fifteen organizations that had participated in the presentations informed the Bureau that they had implemented changes to their tendering process.
The Bureau continued to advocate for the introduction of greater competition in the regulated health sector. With the release of its 2008 study, Benefiting from Generic Competition in Canada: The Way Forward, the Bureau offered tangible recommendations on where potential government and consumer savings of up to $800 million were being lost. One province, Manitoba, has amended its public drug plan policies on the basis of the Bureau�s recommendations and the Bureau continues to consult with other provinces and territories on potential reforms.
Canadian Intellectual Property Office � Revolving Fund
| Expected Result: The delivery of and quality of CIPO�s services respond to client needs and expectations | ||
|---|---|---|
| Indicator | Results | Trend |
Percentage overall satisfaction of clients with CIPO�s services |
74% of clients were satisfied or very satisfied with CIPO�s services, down from 79% in 2005 | Declining |
| Expected Result: Increase awareness and use of intellectual property | ||
| Indicator | Results | Trend |
| Percentage of SMEs that are aware of / familiar with IP | Baseline of 36% established in 2006�07 (next survey: 2010�11) | Not applicable |
| Financial Resources ($ millions) 2008�09 | Human Resources (Full-Time Equivalents) 2008�09 | |||||
|---|---|---|---|---|---|---|
| Planned Spending | Total Authorities | Actual Spending | Planned | Actual | Difference | |
| 4.9 | 139.5 | 12.9* | 1,030 | 944 | -86 | |
* Although CIPO and its clients have been operating in tenuous economic conditions, a positive variance in net operating income was incurred. This variance is primarily due to the prudent management of expenditures, lower investment in capital and changes under various balance sheet accounts such as deferred revenue and accounts payable. We anticipate utilizing the positive variance in future years to maintain current operating levels and to fulfill CIPO�s strategic objectives.
Meeting Our Commitments:
The Canadian Intellectual Property Office (CIPO) continues to focus on becoming more efficient, accessible and responsible to its clients to help them strengthen their competitive advantage, both domestically and globally. To that end, CIPO is improving client access to quality intellectual property (IP) rights in a timely fashion. CIPO is modernizing its e-services platform through the Enterprise Business Renewal Initiative, enhancing the bilingual search capabilities of its databases, and creating a more user-friendly website. Moreover, to improve awareness of intellectual property, CIPO undertook projects in the education and SME sectors to increase understanding by students, creators and innovators of the effective use of IP. These projects included piloting educational tools for university students in science and engineering faculties, prototyping IP data research tools for SMEs, and developing and delivering IP training for intermediaries to leverage their reach to multiple sectors. The Office also formed a new working group with Australia and the United Kingdom (called the Vancouver Group) to explore collaborative initiatives, share best practices and research findings, and compare performance trends.
Strategic Outcome: An Innovative
Economy
| Performance Indicator | Results | Trend |
|---|---|---|
| Business Expenditures on Research and Development (BERD) as a percentage of gross domestic product (GDP) | In 2008, BERD accounted for $16.31 billion, or 1.02% of the GDP, down 0.15 percentage points from 2003 BERD / GDP10 | Declining |
| Higher-Education Research and Development Expenditure (HERD) as a percentage of GDP | In 2008, HERD accounted for $4.53 billion, or 0.28% of the GDP, down 0.2 percentage points from 2003 HERD / GDP11 | Declining |
| Number of people in science and technology occupations as a share of total employment | 1.2 million in 2008, or 7% of total employment, an increase of 0.41 percentage points from 200412 | Improving |
 D
D Scientific discoveries and new technologies provide solutions to many of the issues most important to Canadians, giving us the knowledge and the means to preserve the quality of the environment, protect endangered species, improve health, enhance public safety and security, and manage natural and energy resources. Scientific and technological innovations enable modern economies to improve competitiveness and productivity, providing the means to achieve an even higher standard of living and better quality of life.
External studies undertaken by Industry Canada have identified a number of areas for improvement. For example, to reduce the processing times for Strategic Aerospace and Defence Initiative (SADI) applications, the Department is implementing a lean-process improvement approach, with subsequent continuous improvements.
Based on review and input from external and internal studies, the Industrial Technologies Office (ITO) has updated and re-established a comprehensive approach to the risk management of its programs and projects. Opportunities for an enhanced risk assessment process have been identified, risk management oversight and governance is being improved, and detailed reporting of project and program-level risk is being implemented.
 D
D  D
D
Meeting Our Commitments:
In an effort to foster a knowledge-based economy, Industry Canada implemented all commitments stated in the Science and Technology Strategy. Significant progress has also been made to create value for Canadians and lay the foundation for benefits from science and technology in the future. The Department also supported the generation and commercialization of knowledge by supporting innovation in aerospace and defence and supplementing access to information and communications technologies.
In January 2009, the Communications Research Centre (CRC) received an Emmy Award for its contribution to the standardization of the Advanced Television Systems Committee (ATSC) digital television (DTV) standard at the Academy of Television Arts & Sciences annual Technology & Engineering Awards. CRC's contributions to the ATSC standard helped define the way high-definition television (HDTV) is broadcast to homes in the United States and Canada. Its Advanced Television Evaluation Laboratory (ATEL) conducted two rounds of extensive subjective tests and produced results that were critical in the adoption of the ATSC standard in North America.
The Department completed Technology Roadmaps, bringing together representatives from industry, its supply chain, academia, research groups and government to identify and prioritize the technologies needed to create new products to meet future market demands.
The Automotive Innovation Fund (AIF) was established to provide automotive firms with access to $250 million over five years in support of strategic, large-scale R&D projects to build innovative, greener, more fuel-efficient vehicles.
Benefits to Canadians:
- Through its commitments to S&T, invested in a stronger economy, future opportunities for jobs and an improved quality of life for Canadians, which will contribute to a sustainable national competitive advantage
- Through CANARIE, which provides a high-speed research network, provided Canadians with the opportunity for international collaboration on projects in areas such as health care, the environment and weather monitoring
- Through SADI, recipient companies contributed to Canada�s knowledge-based economy, increased collaboration with research institutes, universities, colleges and non-profit organizations
- Technology Partnerships Canada (TPC) and Program for Strategic Industrial Projects (PSIP) recipients developed and improved innovative technologies, stimulated private sector involvement, and provided opportunities for economic growth
- The Science, Technology and Innovation Council (STIC) provided advice on the design of the developed Canada Excellence Research Chairs Program and the Vanier Canada Graduate Scholarships Program and drafted STIC�s first State of the Nation Report on Canada�s Science, Technology and Innovation System
An investment of $113 million was announced in June 2008 to fund 127 Canada Research Chairs from 35 universities across the country. The Canada Foundation for Innovation also contributed $4.8 million to fund research infrastructure. The Canada Research Chairs Program attracts the best talent from Canada and around the world, helping universities achieve research excellence in natural sciences and engineering, health sciences, and social sciences and the humanities.
For more information: Research Excellence
Performance Analysis:
Through the following program activities, Industry Canada continued to build an innovative economy.
Science and Innovation Sector � Science and Technology (S&T) and Innovation
| Expected Result: Development and coordination of policy frameworks in support of an innovative economy | ||
|---|---|---|
| Performance Indicator | Results | Trend |
| Policy proposals that are brought forward to reinforce the elements that advance an innovative economy and reflect a coordinated approach based on tools available across the sector | Policy proposals were brought forward aimed at advancing an innovative economy and were championed for inclusion in the budget. Budget 2009, tabled on January 27, 2009, included initiatives that will result in cumulative S&T funding of over $5 billion, of which $3.8 billion will be spent by next fiscal year | Improving |
| Financial Resources ($ millions) 2008�09 | Human Resources (Full-Time Equivalents) 2008�09 | |||||
|---|---|---|---|---|---|---|
| Planned Spending | Total Authorities | Actual Spending | Planned | Actual | Difference | |
| 101.1 | 100.0 | 99.7 | 74 | 70 | -4 | |
Meeting Our Commitments:
To foster innovation, Industry Canada supported granting councils by providing funding for research in priority areas and by enhancing their accountability and responsiveness. The Department bolstered the Canada Graduate Scholarships Program to offer an additional 1,000 scholarships, as announced in Budget 2007. These awards provided incremental federal support for top Canadian graduate students pursuing advanced training and research at Canadian universities. Opened to students from all disciplines, the Industrial R&D Internship Program (IRDI), coordinated through NSERC, provided interns with the opportunity to apply their research skills to real-world challenges while connecting firms with intellectual capital and potential future employees. The program placed 468 graduate student and post-doctoral interns in firms across Canada last year.
In support of an innovative economy, Industry Canada, with its partners, the Business Development Bank of Canada (BDC), National Research Council Canada (NRC), and the Natural Sciences and Engineering Research Council (NSERC), took immediate actions aligned with the federal S&T strategy to collaborate more closely and to share resources and expertise with the intent of accelerating the commercialization of publicly funded research that capitalizes on the individual strengths of these organizations. A steering committee was established to track the project�s progress, accelerate critical initiatives and identify fresh opportunities to work together effectively.
Industry Canada monitored progress in five priority areas and ensured that it was reported to ministers at the North American Leaders� Summit in Montebello, Quebec, in August 2007. The five areas are Enhancing the Global Competitiveness of North America, Safe Food and Products, Sustainable Energy and Environment, Smart and Secure Borders, and Emergency Management and Preparedness.
Industry Sector � S&T and Innovation
| Expected Result: Innovative Canadian Industries | ||
|---|---|---|
| Performance Indicator | Results | Trend |
| Increase year-over-year in industrial R&D13 expenditures |
2007P: $16.2 billion 2008P: $16.3 billion14 Change: 0.97% P: Preliminary estimate |
No change |
| Financial Resources ($ millions) 2008�09 |
Human Resources (Full-Time Equivalents) 2008�09 | |||||
|---|---|---|---|---|---|---|
| Planned Spending | Total Authorities | Actual Spending | Planned | Actual | Difference | |
| 9.5 | 101.0 | 90.4* | 83 | 79 | -4 | |
* The variance is a result of additional authorities approved in 2008�09.
Meeting Our Commitments:
To support innovation in targeted Canadian industries, Industry Canada announced two funding programs: the Automotive Innovation Fund AIF and the CSeries Program. Under the AIF, Industry Canada signed one contribution agreement for up to $80 million to support strategic, large-scale R&D projects for the development of innovative, greener and more fuel-efficient vehicles. In addition, through the CSeries Program, the Department announced its intention to make a repayable investment of up to $350 million for the research and development of new aerospace technologies that will lead to more fuel-efficient and safer commercial aircraft.
Furthermore, Industry Canada facilitated the completion of 10 industry-led Technology Roadmaps (TRM) enabling industries � from hydrogen fuel cells to textiles to health management � to focus more effectively on R&D investments. Industry Canada also supported the creation of the Green Aviation Research and Development Network (GARDN), a business-led centre of excellence for the aerospace industry.
Spectrum, Information Technologies and Telecommunications Sector � S&T and Innovation
| Expected Result: Improved science and research capacity and commercialization of information and communications technologies | ||
|---|---|---|
| Performance Indicator | Results | Trend |
| Percentage of the top 50 Canadian R&D universities that utilize CANARIE�s Advanced Network | 98% of the top 50 Canadian R&D universities are now connected to the CANARIE Network | New indicator |
| Number of new technologies and applications developed in the areas of intelligent systems and advanced robotics through Precarn�s collaborative model | Precarn developed 30 new technologies and applications | New indicator |
| Financial Resources ($ millions) 2008�09 | Human Resources (Full-Time Equivalents) 2008�09 | |||||
|---|---|---|---|---|---|---|
| Planned Spending | Total Authorities | Actual Spending | Planned | Actual | Difference | |
| 18.4 | 30.2 | 29.5* | 4 | 4 | 0 | |
* This includes the $28-million payment is the third instalment of the $120-million conditional grant for CANARIE�s Advanced Network. The amount paid is based on CANARIE�s cash flow requirements, reported annually to the Minister before an instalment is issued.
Meeting Our Commitments:
Network operations continue to be extended and optimized to deliver high-quality service to Canada�s research and education community. As a result, more than 50 organizations now have access to, and use of, the CANARIE Network through the Infrastructure Extension Program. Additionally, and in support of an innovative economy, CANARIE encouraged the definition and implementation of collaborative projects that will accelerate the development of, and participation in, national and international cyber-infrastructure and e-research platforms.
Communications Research Centre Canada
| Expected Result: Communications sector clients receive the required technical input to develop telecommunications policies, regulations, programs and standards | ||
|---|---|---|
| Performance Indicator | Results | Trend |
| Extent of client satisfaction (related to content, timeliness and usefulness) with Communications Research Centre technical inputs and assessments used to develop telecommunications policies, regulations, programs and standards | No formal client satisfaction survey was undertaken during the year. However, client feedback indicated that CRC contributes positively to policy, regulations and standards initiatives | Not applicable |
| Expected Result: Canadian companies use CRC-developed technology to enhance their product lines and competitiveness | ||
|---|---|---|
| Performance Indicator | Results | Trend |
| Sales revenue of Canadian communications companies with a technology link to Communications Research Centre | A study of CRC�s economic impact is undertaken every 5 years, with the next study due in 2010. The last study (2005�06) by an external consultant pointed to $1.6 billion in annual sales revenues from CRC spinoff companies, and cumulative industry sales resulting from CRC IP licences to the year 2005 of $520 million | Not applicable |
| Financial Resources ($ millions) 2008�09 | Human Resources (Full-Time Equivalents) 2008�09 | |||||
|---|---|---|---|---|---|---|
| Planned Spending | Total Authorities | Actual Spending | Planned | Actual | Difference | |
| 43.1 | 60.3 | 57.4* | 400 | 374 | -26 | |
* The variance is a result of increased salary costs from collective agreements, recapitalization of scientific equipment, increased respendable revenues from collaborative research agreements and campus operation activities, and spectrum monitoring support for the Vancouver 2010 Winter Games.
Meeting Our Commitments:
Industry Canada, through the CRC, provided technical input and expertise to its various partners and clients on multiple occasions. The CRC is participating in a multi-partner CANARIE project called Health Services Virtual Organization (HSVO) to create a sustainable platform for the experimental development of shared information and communications technology (ICT)-based health services. As its contribution, the CRC provided infrastructure support as well as specialized software. The CRC also provided support to the Department�s telecommunications policy-making and spectrum regulation through a number of projects and studies, including interference studies from new technologies, such as white space and unlicensed devices on DTV reception; review of orbital licence allocation proposals; cognitive radio simulations and analysis to support technical inputs to IEEE 802.16 standards; and development of new techniques for detecting and identifying malicious attacks on networks, as part of a Canadian and global effort to improve security for business and other transactions.
The Department also contributed to the International Telecommunications Union (ITV) in the areas of HDTV and 3D-TV quality assessment, audio loudness measurement and Software Defined Radio (SDR).
Industrial Technologies Office � Special Operating Agency
| Expected Result: Leading-edge research and development in Canadian firms | ||
|---|---|---|
| Performance Indicator | Results | Trend |
| Dollar of private sector investment leveraged per dollar of Agency investment in ITO projects | $2 |
New indicator |
| Financial Resources ($ millions) 2008�09 | Human Resources (Full-Time Equivalents) 2008�09 | |||||
|---|---|---|---|---|---|---|
| Planned Spending | Total Authorities | Actual Spending | Planned | Actual | Difference | |
| 311.8 | 333.5 | 294.6 | 96 | 85 | -11* | |
* The variance is due to a high staff turnover.
Meeting Our Commitments:
Industry Canada successfully wound down the h2 Early Adopters (h2EA) Program for the March 31, 2008, closing date. The 2008 h2EA final evaluation indicated that government and industry representatives saw the program as being in line with industry needs when established in 2003. The approved projects represented over 50 companies, including technology providers, funding partners and suppliers. Most companies experienced technical learning and general improvements in their capabilities in hydrogen technology.
The Department also invested in nine new SADI projects valued at $395.4 million, which leveraged upwards of $723 million in additional R&D investment commitments, thereby enhancing competiveness in the aerospace and defence industry.
In addition, the Department disbursed $238 million to the legacy Technology Partnerships Canada (TPC) and Program for Strategic Industrial Projects (PSIP) programs.
Strategic Outcome: Competitive
Industry and Sustainable Communities
| Performance Indicator | Results | Trend |
|---|---|---|
| Investment in machinery and equipment as a proportion of GDP | Canada invested 7.17% of GDP in machinery and equipment in 2008, a decrease of 0.3 percentage points from 200715 | Declining |
| International ranking of Canada in the use of information and communications technologies | Canada ranks 19th out of 154 countries in terms of level of advancement in the use of information and communications technology (ICT), down from 9th in 200216 | Declining |
 D
D Competitive industry and sustainable communities help to ensure good jobs, economic growth, and a high standard of living and quality of life for all Canadians. Canadian businesses compete in a constantly changing modern marketplace with ever-increasing competition for skilled workers and customers. A better understanding of the many challenges and opportunities that our businesses face will help our companies to compete and prosper in the global, knowledge-based economy.
Since the program was launched in February 2008, 65 grants totalling $12,539,542 have been made available to municipalities that have experienced increased costs for their Canada�Ontario Infrastructure Program water projects to comply with changes to Ontario drinking water regulations. This one-time investment of up to $50 million enables these municipalities to respond to economic development opportunities and helps rebuild community capacity and ensure that communities continue to grow as vibrant and productive places, while providing Canadians with a quality of life that is second to none.
For more information: Ontario Potable Water Program
 D
D 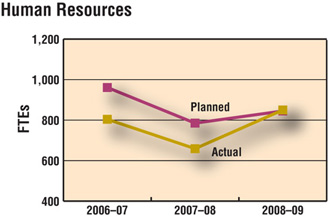 D
D
Meeting Our Commitments:
In 2008�09, the Department, in meeting its commitment to foster competitiveness, focused on the automotive sector. Working with the U.S. Treasury, a coordinated strategy was implemented to assist automotive companies in their restructuring efforts, laying the foundation for a more globally competitive automotive sector.
Benefits to Canadians:
- Strengthened tourism through policy integration and advocacy
- Helped small and medium-sized businesses and entrepreneurs to grow and prosper
- Administered the Ontario Potable Water Program, and delivered infrastructure programs such as the Canada�Ontario Municipal Rural Infrastructure Fund, which enable increased community capacity to respond to economic development opportunities and challenges
- Delivered refurbished computers through the Computers for Schools program to ensure that more Canadians have access to the tools necessary to live and work successfully in the knowledge economy
An evaluation of the FedNor-delivered Community Futures (CF) Program was carried out in 2008. The evaluation identified a continued need for the CF Program and determined that the program functions well and is successful and cost-effective. One recommendation was for FedNor to conduct a review of performance data collected for the CF Program to ensure reliable and meaningful reporting and to establish additional indicators to provide information for assessing its long-term impact. In response, the Department agreed to conduct a review of the performance measurement and reporting systems currently in use and to take necessary action to ensure that high-quality and reliable data are collected.
Performance Analysis:
Through the following program activities, Industry Canada continued to build competitive industries and sustainable communities.
Strategic Policy Sector � Economic Development
| Expected Result: Development and coordination of policy frameworks in support of competitive industry and sustainable communities | ||
|---|---|---|
| Performance Indicator | Results | Trend |
| Development and coordination of economic policy frameworks that support the competitiveness of Canadian industries and help ensure the sustainability of communities across the country |
|
Not applicable* |
* Trends in performance indicators are not useful to measure due to the nature of the work of this program activity, where actual results vary from year to year, depending on the current agenda and priorities of the government. Recognizing the inherent difficulties in measuring the performance of the program activity, Public Policy Services has been moved under Internal Services in the 2009�10 PAA.
| Financial Resources ($ millions) 2008�09 | Human Resources (Full-Time Equivalents) 2008�09 | |||||
|---|---|---|---|---|---|---|
| Planned Spending | Total Authorities | Actual Spending | Planned | Actual | Difference | |
| 6.6 | 15.5 | 15.4* | 38 | 37 | -1 | |
* The variance can be explained by the transfer of funds to new responsibilities.
Meeting Our Commitments:
The development of Industry Canada�s 5th Sustainable Development Strategy (SDS V) has been delayed until fiscal year 2010�11, due to the passage of a new Federal Sustainable Development Act (FSDA) in June 2008. The Act requires that departments table their next SDS in June 2011, and that it be closely aligned, where appropriate, with the federal SDS, which will be tabled in June 2010.
In order to build the appropriate policy frameworks supporting competitive industries, Industry Canada officials provided trade policy advice to DFAIT and other departments throughout 2008�09 on issues related to telecommunications, investment, competition, intellectual property and industrial policies related to key sectors including autos, shipbuilding, aerospace, apparel and textiles. Departmental officials advised and participated in negotiations with the Andean communities. Free Trade Agreement (FTA) negotiations with Colombia and Peru were successfully completed and signed. FTA negotiations with the Caribbean community and the Dominican Republic were put on hold due to domestic issues within those countries. Investment negotiations with Jordan were successfully completed and an agreement is targeted for signature in 2009. For further information, see Negotiations and Agreements.
Small Business and Marketplace Services and Regional Operations Sector � Economic Development
| Expected Result: A business environment that supports entrepreneurship, sustainable communities, growth and competitiveness across Canada, and recognizes regional perspectives | ||
|---|---|---|
| Performance Indicator | Results | Trend |
| Number of new or improved departmental programs, services and information products that target SMEs | 1 information database was improved: the Canadian Company Capabilities (CCC) database of 60,000 Canadian companies used by the private and public sectors to source Canadian products and services 3 new services were provided by the Canada�Ontario Business Service Centre, including provision of telephone services in Spanish; provision of online information in Polish, Russian and Urdu; and service partnerships with Service Canada and Service Ontario |
New indicator |
| Financial Resources ($ millions) 2008�09 | Human Resources (Full-Time Equivalents) 2008�09 | |||||
|---|---|---|---|---|---|---|
| Planned Spending | Total Authorities | Actual Spending | Planned | Actual | Difference | |
| 235.6 | 315.4 | 272.3 | 523 | 507 | -16 | |
Meeting Our Commitments:
In 2008�09, Industry Canada worked with its partners to increase the number of locations offering the BizPaL service by 146% (167 additional municipalities and 3 additional provinces and territories began to offer the BizPaL service). These achievements enabled more Canadians to have access to BizPaL, which provides Canadian businesses with one-stop access to permit and licence information for all levels of government. This translates into savings in the time required to research and find required permits and licences quickly and efficiently in order to comply with government regulations. It also provides entrepreneurs and Canadian businesses with more time to focus on starting or growing their businesses, which, in turn, helps support the Canadian economy.
The Department also completed a program renewal exercise to serve ongoing funding for the Canadian Business Network (CBN), an information service for small business delivered in partnership with the Atlantic Canada Opportunities Agency, Western Economic Diversification Canada and the Economic Development Agency for the Regions of Quebec.
FedNor continued to provide support for regional development in Ontario through the Northern Ontario Development Program, the Eastern Ontario Development Program and the Community Futures Program. Notably, FedNor continued to deliver its $14.7-million commitment to help establish the Molecular Medicine Research Centre in Thunder Bay. This will help support leading-edge research that has commercial potential and will foster strategic alliances among research and postsecondary educational institutions, the private sector, communities and the government.
Industry Sector � Economic Development
| Expected Result: Competitive and sustainable Canadian industries | ||
|---|---|---|
| Performance Indicator | Results | Trend |
| Increase in year-over-year Industry Sector�s GDP |
2007: $524.7 billion 2008: $519.4 billion17 Change: -1.0% |
Declining |
| Financial Resources ($ millions) 2008�09 | Human Resources (Full-Time Equivalents) 2008�09 | |||||
|---|---|---|---|---|---|---|
| Planned Spending | Total Authorities | Actual Spending | Planned | Actual | Difference | |
| 66.8 | 81.4 | 77.9* | 235 | 226 | -9 | |
* The variance is a result of additional authorities approved in 2008�09.
Meeting Our Commitments:
In an effort to support the competitiveness and sustainability of Canadian industries, Industry Canada requested that two automotive firms improve their cost structures outlined in their respective restructuring plans. As the companies each made sacrifices to help ensure a sustainable, competitive company going forward, the government supported their efforts to restructure.
To further support other Canadian industries, the Department also approved 32 projects through the Canadian Apparel and Textile Industries Program (CATIP), with total funding of $2.4 million. Additionally, six contribution agreements, representing over $80 million of value in sales to Canadian shipyards, were signed through the Structured Financing Facility (SFF). Moreover, as of March 31, 2009, the Industrial and Regional Benefits (IRB) policy has resulted in over $15 billion in commitments to invest in Canada. With the government�s unveiling of the Canada First Defence Strategy, planned future procurements could exceed $40 billion in new IRB opportunities over the next 10 years. Industry Canada also undertook activities to better inform trade negotiations and policy development, including improving market access to Japan for Canadian wood building products.
Spectrum, Information Technologies and Telecommunications Sector � Economic Development
| Expected Result: Aid Canadian ICT companies in positioning themselves for industrial opportunities and growth in the global marketplace | ||
|---|---|---|
| Performance Indicator | Results | Trend |
| Number of requests by Canadian ICT companies for business development services (e.g. investment) | There were 567 requests by ICT companies for business services to address major challenges along common themes such as scientific research and experimental development and funding options, as well as company support available for various global events and business opportunities* | New indicator |
* Including CommunicAsia, BroadcastAsia, Expo Comm China, FutureCom and Mobile World Congress (MWC)
| Financial Resources ($ millions) 2008�09 | Human Resources (Full-Time Equivalents) 2008�09 | |||||
|---|---|---|---|---|---|---|
| Planned Spending | Total Authorities | Actual Spending | Planned | Actual | Difference | |
| 26.1 | 43.7 | 43.6 | 49 | 80 | 31* | |
* The variance arises from the fact that no resources were reported in the RPP for the Community Access Program and the Computers for Schools program, as the program authorities were still pending at the time.
Meeting Our Commitments:
Industry analysis and support resulted in common issues being identified and validated in order to provide suggestions to improve policy, programs and services to the ICT sector. The Department engaged stakeholders in all regions and sub-sectors of the ICT industry across Canada to encourage sharing of information such as business factors that affect productivity, sustainability and growth of the sector. The intelligence gathered was shared with the Trade Commissioner Service to assist in matching Canadian capabilities to foreign needs in order to enable companies to be better positioned to compete in global markets.
Mackenzie Gas Project
| Expected Result: Development of Mackenzie gas resources supports sustainable communities | ||
|---|---|---|
| Performance Indicator | Results | Trend |
| Provide up to $2 million to Northwest Territorial Aboriginal communities living along the proposed pipeline route to facilitate development of regional investment plans | Provided $1.8 million to 5 Aboriginal communities to assist them in continuing and/or finalizing the development of regional investment plans |
New indicator |
| Financial Resources* ($ millions) 2008�09 | Human Resources* (Full-Time Equivalents) 2008�09 | |||||
|---|---|---|---|---|---|---|
| Planned Spending | Total Authorities | Actual Spending | Planned | Actual | Difference | |
| - | 7.9 | 5.0 | N/A | N/A | N/A | |
* Data are not available due to the fact that the Mackenzie Gas Project was transferred to Industry Canada from Indian and Northern Affairs Canada late in 2007�08 and then was transferred to Environment Canada late in 2008�09.
Meeting Our Commitments:
The Mackenzie Gas Project (MGP) is a proposed 1,220-kilometre natural gas pipeline system through the Mackenzie Valley in the Northwest Territories that will connect northern onshore gas fields with North American markets. It has the potential to make key contributions to promoting economic development in the Northwest Territories. The Mackenzie Gas Project Office will continue to coordinate federal government efforts to support the MGP.
4 Indicators of Product Market Regulation. OECD, 2008
5 Economic Policy Reforms: Going for Growth. OECD, 2009
6 World Competitiveness Yearbook. International Institute for Management Development (IMD), 2008
7 World Competitiveness Yearbook. IMD, 2008
8 Indicators of Product Market Regulation. OECD, 2008
9 World Competitiveness Yearbook. IMD, 2008
10 Business Expenditures on R&D Compared to GERD and GDP. Table 3. Statistics Canada, 2009
11 GERD - By Performing Sector and Funding Sector. Table 1-2. Statistics Canada, 2009
12 Employment by Industry. Statistics Canada, 2009
13 Intramural expenditures: expenditures for R&D work performed within the reporting company, including work financed by others
14 Total Intramural Research and Development Expenditures - By Industry. Table 1-1. Statistics Canada, 2009
15 Real Gross Domestic Product, Expenditure Based. Statistics Canada, 2009
16 Measuring the Information Society: The ICT Development Index. International Telecommunications Union, 2009, p.32
17 National Economic Account � CANSIM Table. Statistics Canada, 2009
Section 3: Supplementary Information
3.1 Financial Highlights
The financial highlights presented within this DPR are intended to serve as a general overview of IC's financial position and operations. The Department's financial statements can be found on IC's website.
| ($ millions) | % Change | 2009 | 2008 |
|---|---|---|---|
| Condensed Statement of Financial Position (unaudited) At March 31 |
|||
| ASSETS | |||
| Financial Assets | 11 | 1,823 | 1,635 |
| Non-Financial Assets | -1 | 110 | 111 |
| TOTAL | 11 | 1,933 | 1,746 |
| LIABILITIES | |||
| Accounts Payable and Accrued Liabilities | -24 | 650 | 856 |
| Deferred Revenue (Note 1) | 417 | 4,957 | 958 |
| Other Liabilities | 14 | 496 | 434 |
| Total Liabilities | 171 | 6,103 | 2,248 |
| EQUITY | 731 | (4,170) | (502) |
| TOTAL | 11 | 1,933 | 1,746 |
| Condensed Statement of Operations (unaudited) For the period Ended March 31 |
|||
| EXPENSES | |||
| Transfer Payments | -18 | 502 | 610 |
| Operating Expenses | 6 | 803 | 758 |
| Total Expenses | -5 | 1,305 | 1,368 |
| REVENUES | |||
| Sales of Services | 13 | 772 | 681 |
| Other | -23 | 36 | 47 |
| Total Revenues | 11 | 808 | 728 |
| NET COST OF OPERATIONS | -22 | 497 | 640 |
Note 1: Increase in liability of $4.26 billion from an auction for Advanced Wireless Services and Other Spectrum in the 2 GHz Range. This revenue is recognized over a 10-year period.
 D
D Total assets were $1.93 billion at the end of 2008�09, an increase of $187 million (11%) versus last year�s total assets. This increase is mainly due to the change of total financial assets, which is composed of accounts receivable and advances of $102 million, loans of $405 million, and investments of $1.32 billion. During FY 2009, an additional $250 million investment in the Business Development Bank of Canada caused a significant increase in financial assets. The rest of the variation was the combined result of loans and accounts receivable.
 D
D Total liabilities were $6.10 billion at the end of 2008�09, an increase of $3.86 billion (171%) versus last year�s total liabilities. The deferred revenue is the largest liability on the statement of financial position, representing 81% of total liability. At the end of FY 2009, deferred revenue was $4.96 billion, with a significant increase of $4.26 billion in comparison to last year, and this increase is attributed to an auction for Advanced Wireless Services and Other Spectrum in the 2-GHz Range. The deferred revenue is being recognized on a straight-line basis over the next 10 years.
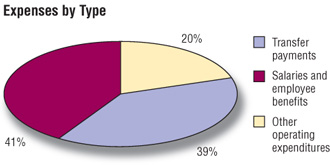 D
D Total expenses were $1.31 billion in 2008�09, a decrease of $63 million (5%) versus last year�s total expenses. The decrease is mainly attributed to a decrease of total transfer payments of $108 million due to a one-time payment of $105 million made in FY 2008, and it is partially offset by an increase in salaries and employee benefits and other minor changes in other operating expenditures.
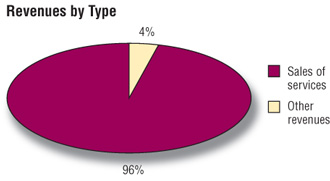 D
D Total revenues were $808 million in 2008�09, an increase of $80 million (11%) versus last year�s total revenues. Sales of services account continued to be the largest revenue component, representing 96% of total revenue. The main revenue streams include license fees, $496 million; trademarks, patents, copyrights, $144 million, and other, $168 million. The variation of $80 million in FY 2009 is attributable largely to the recognition of revenue from the spectrum auction recorded as a liability.
3.2 List of Tables
The following information is available on the Treasury Board Secretariat's website at:
http://www.tbs-sct.gc.ca/dpr-rmr/st-ts-eng.asp
- Table 1 � Sources of Respendable and Non-respendable Revenue
- Table 2 � User Fees / External Fees
- Table 3 � Details on Industry Canada's Transfer Payment Programs (TPPs)
- Table 4 � Up-Front Multi-Year Funding (formerly Foundations (Conditional Grants))
- Table 5 � Horizontal Initiatives
- Table 6 � Sustainable Development Strategy
- Table 7 � Green Procurement
- Table 8 � Response to Parliamentary Committees and External Audits
- Table 9 � Internal Audits and Evaluations
3.3 Other Items of Interest
IM/IT Governance and Responsibilities at Industry Canada
Section 41, Official Languages Act
3.4 Additional Information for Program Activities by Strategic
Outcome
- A Fair, Efficient and Competitive Marketplace
- An Innovative Economy
- Competitive Industry and Sustainable Communities