ARCHIVED - Statistics Canada - Report
 This page has been archived.
Archived Content
Information identified as archived on the Web is for reference, research or recordkeeping purposes. It has not been altered or updated after the date of archiving. Web pages that are archived on the Web are not subject to the Government of Canada Web Standards. As per the Communications Policy of the Government of Canada, you can request alternate formats on the "Contact Us" page.
2011-12
Report on Plans and Priorities
Statistics Canada
The original version was signed by
The Honourable Christian Paradis
Minister of Industry and Minister of State (Agriculture)
Table of Contents
- 1.1 Raison d’être and responsibilities
- 1.2 Statistics Canada’s Corporate Management Framework and strategic outcome
- 1.3 Strategic outcome and program activity architecture
- 1.4 Planning summary
- 1.5 Contribution of priorities to the strategic outcome
- 1.6 Risk analysis
- 1.7 Expenditure profile
- 1.8 Estimates by vote
Section 2 — Analysis of program activities
- 2.1 Economic Statistics
- 2.2 Social Statistics
- 2.3 Census, Demography and Aboriginal Statistics
- 2.4 Internal services
Section 3 — Supplementary information
Section 4 — Other items of interest
Minister's message
As Canada's economy shows continued signs of growth following the global recession, the Harper Government has a clear vision for Canada. We remain focused on creating jobs and economic growth in all regions of Canada. We remain committed to fighting protectionism, the number one impediment to global economic recovery. And we will continue to support science and technology as it drives innovation to improve quality of life for Canadians.
In the coming year, Industry Canada and its portfolio partners will seize the opportunities of the evolving global economy. We will set the conditions for industrial success by improving the policy we put in place, making strategic investments and supporting business-focused programs and services. We are working to remove impediments to competition and to create the best climate for international investment. Industry Canada will lead efforts in developing major policy initiatives to support Canada’s digital economy and shape a whole-of-government strategy for federal tourism activities. The Department will also improve the cost-effectiveness and efficiency of its own operations and work with recovering industries and sectors to help assure a solid and prosperous future.
In 2011/2012, Statistics Canada will continue to provide Canadians with trusted information that responds to the nation’s highest priority needs to support both public and private decision making. Priorities include completing collection of the 2011 censuses of population and agriculture, completing collection of the new National Household Survey, ensuring the continued relevance and quality of our economic and social statistics and increasing the efficiency of the agency’s operations.
And, as always, I will work with the Industry portfolio partners, the private sector and other governments to create the fundamentals for a strong and competitive economy.
It is my pleasure to present this year’s Report on Plans and Priorities for Statistics Canada.
The original version was signed by Christian Paradis
Minister of Industry and Minister of State (Agriculture)
Chief Statistician's message
I am pleased to present Statistics Canada’s Report on Plans and Priorities.
As Chief Statistician of Canada, my goal is to ensure that Canadians continue to have access to a trusted source of statistics meeting their highest priority information needs. The efficient production of relevant, accessible, high-quality statistics helps to ensure that our economy functions efficiently and our society is governed effectively.
Public confidence in national statistics is fundamental to Statistics Canada. Indeed, Canada owes the success of its statistical system to a long-standing partnership between the national statistical agency and the nation’s citizens, businesses, governments and other institutions. Accurate and relevant statistical information can only be collected and produced with this continued co-operation.
This is especially true with respect to the Census of Population. In 2011, every household in Canada will receive a Census questionnaire. Statistics Canada will also conduct the Census of Agriculture and, for the first time, the voluntary National Household Survey in lieu of the previous mandatory long-form Census. Other agency priorities for 2011 are to
- deliver ongoing economic and social statistics programs
- continue to renew statistical programs
- improve the agency's business processes and further integrate its results-based corporate infrastructure.
Statistics Canada is committed to ensuring the relevance, accessibility and quality of the nation's statistics. I invite readers to learn more about the work of their national statistical agency by visiting our website, www.statcan.gc.ca. Your feedback is always welcome.
The original version was signed by Wayne R. Smith
Chief Statistician of Canada
Section 1 — Agency overview
1.1 Raison d’être and responsibilities
Statistics Canada seeks to ensure that Canadians have access to a trusted source of statistics on Canada that meet their highest priority information needs. Access to trusted statistical information is an essential underpinning of democratic societies, both to support evidence-based decision-making in the public and private sectors and to inform debate on public policy issues.
Under the Constitution Act of 1867, “census and statistics” was made a federal jurisdiction. Parliament has exercised its responsibility for the census and statistics primarily through the Statistics Act. The Act creates Statistics Canada as Canada’s national statistical office and establishes its mandate, powers and obligations. Under the Act, Statistics Canada must collect, compile, analyse and publish statistical information on the economic, social and general conditions of the country and its people. The Act specifically requires that Statistics Canada conduct censuses of population and agriculture in 1971 and every fifth year thereafter.
Statistics Canada is empowered to conduct surveys of businesses and households on both a voluntary and a mandatory basis; censuses are always mandatory under the Act. Administrative records can also be acquired to assist in the agency’s work. In tandem with these powers, the agency is charged with ensuring the confidentiality of information in its hands and limiting the use of that information to statistical purposes.
Finally, to promote the efficiency of the national statistical system, Statistics Canada is mandated to collaborate with other government departments, as well as provincial and territorial governments, to develop a well-integrated, coherent national system of statistics that minimizes duplication and reporting burden on households and businesses.
Statistics Canada is also mandated under the Corporations Returns Act to collect and publish information on inter-corporate ownership in Canada, with an emphasis on foreign ownership of Canadian enterprises. The particularity of the Corporation Returns Act is that it allows Statistics Canada to disclose information on the ownership of individual corporations, something that would be prohibited under the Statistics Act.
Numerous federal and provincial laws and regulations specifically require information from Statistics Canada for their operation. Some key examples are: the Canada Pension Plan Act (Consumer Price Index); the Employment Insurance Act (Labour Force Survey); the Federal–Provincial Fiscal Arrangements Act (numerous economic and demographic measures); the Income Tax Act (Consumer Price Index); the regulations to the Official Languages Act (census data on official languages); and the Electoral Boundaries Readjustment Act (census).1.2 Statistics Canada's Corporate Management Framework and strategic outcome
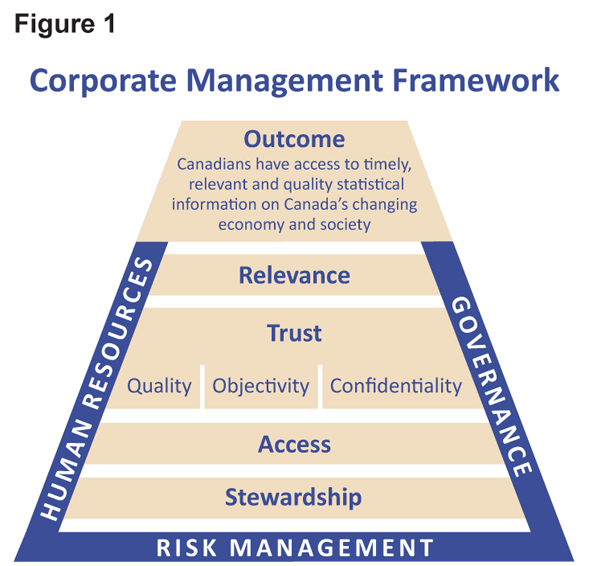
Statistics Canada’s Corporate Management Framework illustrates how the agency delivers its strategic outcome. The following paragraphs briefly describe this framework and the enablers that allow the strategic outcome to be achieved.
Relevance is defined as producing information that meets Canada’s evolving and highest priority needs. Relevance depends on user needs: to understand these needs, both present and future, and to ensure that its products and services meet them, Statistics Canada monitors data usage, and consults with users, stakeholders and advisory committees. Meeting those needs means taking into account how quickly the information is required. A statistical agency’s programs must evolve continuously to stay relevant.
Trust has three dimensions: quality, objectivity and confidentiality. Users must be able to trust that the agency’s statistics are factual and reliable representations of the social and economic worlds they are meant to describe; that they are objective; and that respondents’ information is kept confidential. Quality can also be conceived of in terms of accuracy, interpretability and consistency. These dimensions are described in Statistics Canada’s Quality Assurance Framework http://www.statcan.gc.ca/pub/12-586-x/12-586-x2002001-eng.pdf. To maintain and improve data quality, several measures work jointly at various levels throughout Statistics Canada, including a strong program of research and innovation in statistical methods, regular updates of standard classifications and regular internal quality reviews to identify and eliminate weaknesses—which are also an opportunity to share and promote best practices.
Access refers to awareness and use of Statistics Canada’s rich inventory of information holdings. Access has two channels: publicly available data and microdata for statistical and research use. Access to microdata files is managed to ensure the confidentiality of individual households and businesses is maintained. The agency’s principal access conduit for publicly available statistics is its website. The key conduit for detailed microdata is the national network of Research Data Centres, designed for statistical research in a secure, controlled setting. Both these mechanisms aim to meet the needs of Statistics Canada’s diverse user community.
Stewardship, in the form of strategic leadership and proactive management of resources and assets, is a Statistics Canada tradition. Ensuring probity and value for money in all aspects of our organization is a key component of our Corporate Management Framework. Statistics Canada strives to be a highly efficient organization: information is produced at the lowest possible cost. It has in place a unique governance and management structure, as well as a dynamic system to innovate, manage risks, and anticipate and address emerging issues and opportunities.
The enablers that allow the strategic outcome to be achieved are described below.
Human resources are by far Statistics Canada’s most important asset. Therefore, effective human resource management is a key factor in achieving the agency’s strategic outcome. Given the specialized skill requirements of a statistical agency, effort is focused on recruitment, training, career advancement and maintaining a positive workplace. Statistics Canada fully embraces the Public Service Renewal initiatives in its human resource management practices.
Governance—Statistics Canada has a mature and effective governance and management structure, which integrates strategic priority setting and decision making and ensures accountability.
An established system of corporate-level committees consults managers and recommends strategic options for program development and delivery. Committee membership includes senior managers from across Statistics Canada. The Policy Committee is the lead committee, responsible for strategic direction and corporate-level management and decisions. All significant corporate issues are reviewed at this highest level. The Chief Statistician, as chair of the Policy Committee, renders final decisions.
The decision-making infrastructure, which includes an independent Departmental Audit Committee, encourages innovation and strategies to improve efficiency.
This structure also ensures good governance of material resources—in particular the information and communication equipment and technology that is essential for a modern statistical agency.
Risk management—In keeping with government-wide expectations of good governance and modern comptrollership, Statistics Canada places great emphasis on managing risk in all planning and program delivery activities. Statistics Canada’s risk management model is described in Section 1.6.
Statistics Canada’s strategic outcome, which is supported by a framework of program activities and subactivities, is as follows:Strategic outcome
Canadians have access to timely, relevant and quality statistical information on Canada's changing economy and society for informed debate, research and decision making on social and economic issues.
All Statistics Canada’s activities contribute to the achievement of its strategic outcome and of its two expected results:
- Statistics produced by Statistics Canada are available through a wide range of easily accessible media formats and venues.
- Canadians are aware of the availability of these statistics and of their high quality, and of the professionalism and non-partisanship of Statistics Canada.
1.3 Strategic outcome and Program Activity Architecture
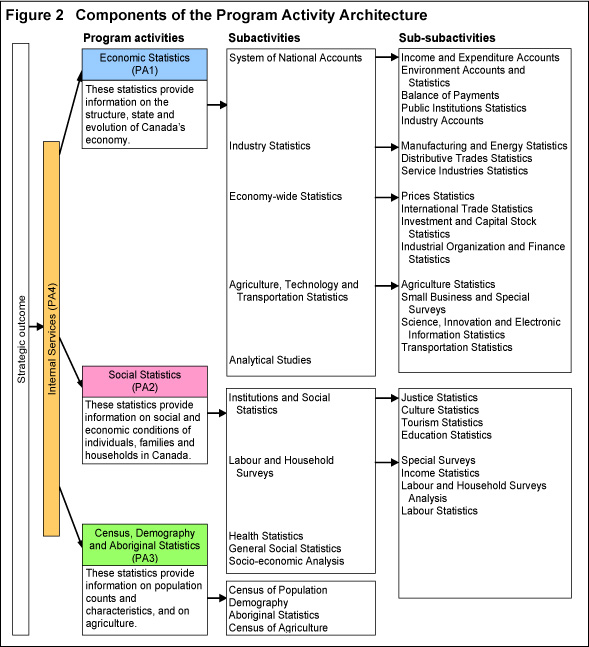
Statistics Canada allocates its resources in accordance with its Program Activity Architecture. Established in consultation with the Treasury Board Secretariat, this architecture reflects Government of Canada standards for transparent and accountable reporting. The architecture comprises three main program activities, and subactivities within each, based on subject matter: Economic Statistics; Social Statistics; and Census, Demography and Aboriginal Statistics. A fourth program activity covers Internal Services.
The subactivities correspond to program activities sponsored by branches in Statistics Canada’s organizational structure. Within the subactivities is a third level of sub-subactivities, which correspond to the agency’s divisions. In all cases, the accountability for a program resides with a division in the organizational structure, but the delivery of the program activities involves the contribution of work units from across the organization, defined as a matrix management structure.
1.4 Planning summary
Financial and human resources
Statistics Canada’s statistical program is funded from two sources: direct parliamentary appropriations and cost-recovery activities. In recent years, the agency’s ‘respendable’ cost-recovery revenues—revenues it is authorized to spend on the activity that generated them—have generally added more than $100 million annually to its total resources. A large portion of these respendable revenues is from federal departments to fund specific statistical projects. Statistics Canada assumes that cost-recovery revenues will remain at the same level each year for the foreseeable future.
The total planned spending and total planned human resources for the next three fiscal years are summarized in the following tables. The tables show the year-to-year variation in Statistics Canada’s resources, the result of the cyclical activity supporting the Census of Population, the National Household Survey (NHS), and the Census of Agriculture. Funding typically peaks in the fiscal year in which the censuses are conducted.
| 2011/2012 | 2012/2013 | 2013/2014 |
|---|---|---|
| 747,595 | 482,764 | 446,049 |
| 2011/2012 | 2012/2013 | 2013/2014 |
|---|---|---|
| 6,461 | 5,812 | 5,390 |
Notes
Planned spending amounts are presented net of respendable revenue.
Planned spending and full-time equivalent (FTE) changes between years are mostly due to the cyclicality of the 2011 census programs, which peak in 2011/2012 and wind down in subsequent years.
Totals may differ between tables because of rounding.
Planned spending
Total planned spending for each program activity, for each of the next three fiscal years, is detailed below. Detailed information, by program activity, on planned activities, indicators, targets, and timelines is presented in Section 2.
| Program Activity | Forecast spending | Planned spending | Alignment to Government of Canada outcomes | ||
|---|---|---|---|---|---|
| 2010/2011 | 2011/2012 | 2012/2013 | 2013/2014 | ||
| thousands of dollars | |||||
| Economic Statistics | 203,457 | 214,120 | 214,940 | 214,451 | A transparent, accountable and responsive federal government. |
| Social Statistics | 191,429 | 191,293 | 197,424 | 197,169 | |
| Census, Demography and Aboriginal Statistics | 188,826 | 369,186 | 92,864 | 56,007 | |
| Internal Services | 86,919 | 86,962 | 87,733 | 87,710 | … |
| Budgetary Main Estimates (gross) | 670,631 | 861,561 | 592,961 | 555,337 | … |
| Less: Respendable revenue | 97,515 | 120,000 | 120,000 | 120,000 | … |
| Subtotal | 573,116 | 741,561 | 472,961 | 435,337 | … |
| Adjustments to Economic Statistics1 | 0 | 6,034 | 9,803 | 10,712 | … |
| Total planned spending | 573,116 | 747,595 | 482,764 | 446,049 | … |
|
Notes |
|||||
1.5 Contribution of priorities to the strategic outcome
Table 4 summarizes Statistics Canada’s operational and management priorities with a list of planned activities and links to the Program Activity Architecture as well as the strategic outcome. Detailed information, by program activity, on planned activities, indicators, targets and timelines is presented in Section 2.
| Priority | Type | Link to Program Activity | Contribution to the strategic outcome and planned activities | Why is this a priority? |
|---|---|---|---|---|
| Operational priorities | ||||
| Deliver ongoing economic and social statistics programs | Ongoing | Economic Statistics Social Statistics |
Relevance |
Statistics Canada’s strategic outcome is to ensure that Canadians have access to a trusted source of statistics meeting their highest priority information needs. The Statistics Act directs the agency to collect, compile, analyse, abstract and publish statistical information relating to the commercial, industrial, financial, social, economic and general activities and
condition of the people. Those duties include producing gross domestic product and other topical economic data, as well as current high-quality data on key areas of social policy concern including employment, education, health and justice. Planned activities
|
| Conduct the Census of Population, the Census of Agriculture, and the National Household Survey | Ongoing | Census, Demography and Aboriginal Statistics | Relevance Trust Access |
Statistics Canada is mandated by legislation to perform a census every five years: 2011 is the year of data collection for the Censuses of Population and Agriculture. These data, along with the data being collected in the new National Household Survey, will produce a statistical portrait of both the Canadian population and of Canada’s farms and their operators. The data are
widely used by all levels of government for policy planning and program development and delivery. Planned activities
|
| Continue to renew statistical programs | Ongoing | Economic Statistics Social Statistics Census, Demography and Aboriginal Statistics |
Relevance Trust Efficiency |
Statistics Canada is responsible for producing relevant and high-quality statistics. Canada and the world continue to evolve. To ensure trust in our statistical programs, the agency must also evolve to stay relevant and maintain their quality. It is a priority to update our programs to reflect the changing reality of Canada’s economy and society while ensuring their quality and
continuity. Planned activities
|
| Management priorities | ||||
| Improve the agency’s business processes and further integrate its results-based corporate infrastructure | Ongoing | Internal Services | Relevance Trust Access Efficiency |
Improve the effectiveness and efficiency of corporate business processes, and further integrate human resource planning, informatics technology, and program and project planning: these are required to ensure the agency remains relevant and accountable over the long term. Planned activities
|
1.6 Risk analysis
While risk management has always been an important part of Statistics Canada’s operations, significant progress has been made over the past year by bringing risk considerations to the forefront using a risk management model.
Statistics Canada is implementing an integrated model to manage risk. In this model, risks are identified, assessed, dealt with, and monitored. In 2010/2011, corporate and operational risks were identified by senior managers, program managers, and subject-matter experts, then categorized by corporate objective (relevance, trust, access, and stewardship). For each risk identified, expert opinion was obtained from program managers on the probability and potential impact of the residual component of that risk, after taking mitigating strategies into consideration. Where that residual risk was deemed significant, information was collected on the estimated cost of implementing further mitigation strategies and on whether these investments would be worth the cost.
The risk management model includes an agency-wide picture of all identified risks through a detailed risk register and a corporate risk profile considering not only operational or short-term risks, but longer-term strategic risks to the organization. This information is being used to provide context to project proposals as part of the annual long-term planning process.
The 2010/2011 Corporate Risk Profile has identified the following major corporate risks:
- Public trust, confidence and co-operation: The voluntary status of the majority of surveys make the integrity of the statistical program dependent on the co-operation and participation of the public, businesses and institutions in data collection activities. The public’s trust and confidence in the quality and objectivity of Statistics Canada outputs are fundamental pillars of the organization. Domestic and international use of agency outputs may be affected if trust in the organization is compromised and the agency’s professional credibility is questioned.
- Budget and resources: Federal budgets and strategic program reviews may result in adjustments to the resources available to the agency, including respendable revenues from other government departments and agencies.
- Legislation and statutory data requirements: Two-thirds of the agency’s programs have statutory and regulatory data requirements. Unilateral or unanticipated changes in these data requirements may have an impact on statistical programs used to fulfill them.
- Leadership and intergovernmental co-ordination of the national statistics program: Changes in federal-provincial partnerships, or mutually beneficial relationships with other governments may affect the scope, quality or timeliness of data available to the national statistics program.
1.7 Expenditure profile
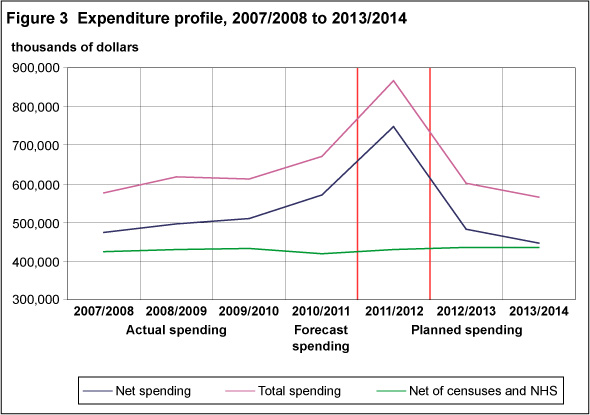
Total and net spending will peak in 2011/2012, when the 2011 Census of Population and NHS and the 2011 Census of Agriculture will be conducted. Expenditures will drop sharply in 2012/2013 as these activities begin to wind down. This pattern is typical for the agency because of the cyclical nature of the census programs—witness the relative stability of the agency’s spending when the census and cost-recovery activities are removed.
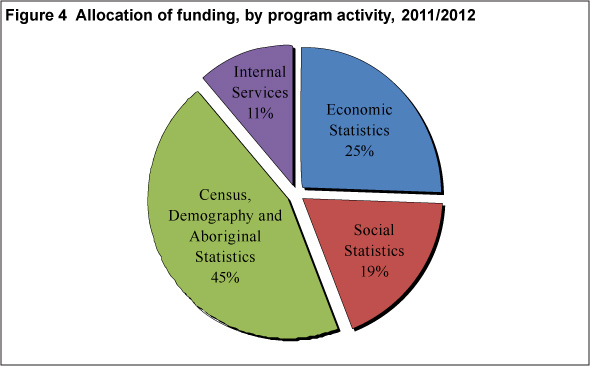
Figure 4 shows how net funding will be distributed by program activity in 2011/2012. In this peak year for census activity, Census, Demography and Aboriginal Statistics will account for 45% of overall spending, a larger share than in 2010/2011. Economic Statistics will account for 25% of spending in 2011/2012 and Social Statistics, 19%.
1.8 Estimates by vote
For information on Statistics Canada’s organizational votes and/or statutory expenditures, please see the 2011/2012 Main Estimates publication. An electronic version is available at http://www.tbs-sct.gc.ca/est-pre/20112012/me-bpd/toc-tdm-eng.asp.
Section 2 — Analysis of program activities
Statistics Canada seeks to ensure that Canadians have access to timely, relevant and quality statistical information on Canada’s changing economy and society for informed debate, research, and decision making on social and economic issues.
The following section describes Statistics Canada’s program activities and the financial and non-financial resources available to each. Planned activities, indicators, targets, and timelines are identified for each of the four program activities:
- Economic Statistics
- Social Statistics
- Census, Demography and Aboriginal Statistics
- Internal Services.
2.1 Economic Statistics
| Human resources (FTEs) and planned spending (thousands of dollars) | |||||
|---|---|---|---|---|---|
| 2011/2012 | 2012/2013 | 2013/2014 | |||
| FTEs | Planned spending | FTEs | Planned spending | FTEs | Planned spending |
| 2,266 | 191,102 | 2,327 | 195,115 | 2,346 | 195,663 |
| Program Activity expected results | Performance indicators | Targets |
|---|---|---|
| Statistics produced by Statistics Canada are available through a wide range of easily accessible media formats and venues. | Number of page views of electronic publications (’000) | Annual increase exceeds 5% |
| Annual percentage increase in the number of page views of electronic publications | ||
| Success in finding information on the Statistics Canada website | 65% of visitors surveyed found what they were looking for | |
| Ease of finding information on the Statistics Canada website | 70% of visitors surveyed would say they were satisfied | |
| Canadians are aware of the availability of these statistics and of their high quality, and of the professionalism and non-partisanship of Statistics Canada. | Number of data series downloaded from the CANSIM online database (’000) | Annual increase in downloaded series exceeds 5% |
| Annual percentage increase in the number of data series downloaded from the CANSIM online database | ||
| Client satisfaction with Statistics Canada’s ability to meet their needs | Rating of 4 out of 5 | |
| Percentage of statistical outputs that meet set levels of sampling accuracy | 95% of major statistical outputs meet set levels of accuracy | |
| Organizational efficiency | Number of business surveys using tax/administrative data (number) | Continual increase |
| Percentage of business surveys using tax/administrative data | ||
| Index of response burden hours (1991 = 100) | 60 or less | |
|
Notes |
||
Program activity description
The Economic Statistics program offers Canadians a set of comprehensive, integrated measures of the structure and evolution of Canada’s economy and environment. The program comprises two main organizational components. The Business and Trade Statistics program collects and disseminates industry and commodity statistics; the System of National Accounts uses input mainly from the Business and Trade Statistics program to provide a conceptually integrated framework of statistics and analysis for studying the evolution of the Canadian economy and environment.
These two components together offer micro- and macro-economic statistics and analysis across the full spectrum of Canadian economic activity, both domestic and international. The statistics cover gross domestic product; production, costs, sales, productivity, and prices for the gamut of industrial sectors; the flows and stocks of fixed and financial capital assets; international trade and finance; foreign ownership in Canada’s economy; federal, provincial, territorial, and municipal government revenues, expenditures and employment; environmental issues related to pollution, natural assets, and activities to reduce environmental damage; consumer and industrial price changes; science and technology; and research and development.
The national accounts measure production of goods and services and the purchase or sale of goods and services in domestic and international markets. Production and consumption are measured in dollar terms. Corresponding price indexes are derived, and estimates of economic activity in ‘real’ or ‘inflation adjusted’ terms are prepared. Monetary flows are tracked in the four major sectors of the economy: households, businesses, governments and non-residents. Saving, investment, assets, liabilities and national wealth are measured. The program supports various statutory requirements. As well, its outputs are vital to the policy development and programs of the Bank of Canada, Finance Canada, Industry Canada, Foreign Affairs and International Trade and several other federal, provincial and territorial departments and agencies. National accounts outputs are also widely used in the private sector and by international agencies such as the International Monetary Fund (IMF), the Organisation for Economic Co-operation and Development (OECD) and the United Nations (UN).
The Analytical Studies program integrates and analyses data collected by Statistics Canada and others to describe Canada’s economy and society—information vital for a competitive and rapidly evolving economy. Analytical Studies develops new, better techniques for the statistical analysis and interpretation of socio-economic datasets. The program also produces analytical data products such as the annual estimates of multifactor productivity, longitudinal worker files, and health databases. It also publishes about 70 analytical reports per year. These activities are vital for the Bank of Canada, Finance Canada, Industry Canada, and the private sector financial community.
The activities of several programs, particularly the System of National Accounts, support statutory requirements. For example, national accounts data are used to manage the Fiscal Arrangements Act and to allocate Harmonized Sales Tax (HST) revenue among Canada and the provinces that collect the HST. The programs described below provide inputs—statistical information and advice on its use.
- The Economy-wide Statistics program covers financial and taxation statistics for enterprises, international trade, investment, capital stock, and prices.
- The Industry Statistics program covers retail and wholesale trade, manufacturing, construction, energy, and services.
- The Agriculture, Transportation and Technology program covers agriculture, science, technology, broadcasting, telecommunications, innovation, electronic commerce, small business, and transportation. The program also conducts special surveys.
To fulfill their purpose, statistics produced by these programs must be of high quality and must accurately depict the performance of Canada’s economy. They must also be promptly delivered, coherent and accessible. The programs must produce these statistical measures efficiently and with the least possible burden on the businesses, farmers and other Canadians responding to their surveys.
Statistics Canada continues to update the Economic Statistics program to reflect the changing realities of the Canadian economy. At the same time, it strives to make its processes more efficient by using more and more administrative data and modern technology for surveying and processing data. The goal is to expand data access to Canadians while maintaining or improving the data quality and timeliness they have come to expect.
A more detailed description of this program activity and planned release dates can be found at: http://www.statcan.gc.ca/about-apercu/structure/paa-aap-eng.htm and http://www.statcan.gc.ca/release-diffusion/index-eng.htm.
Priorities
Table 6 summarizes the priorities of the Economic Statistics program activity.
| Priority | Type | Link to Program Activity | Contribution to the strategic outcome and planned activities | Why is this a priority? |
|---|---|---|---|---|
| Operational priorities | ||||
| Deliver ongoing economic and social statistics programs | Ongoing | Economic Statistics | Relevance Trust Access |
Statistics Canada’s strategic outcome is to ensure that Canadians have access to a trusted source of statistics meeting their highest priority information needs. The Statistics Act directs the agency to collect, compile, analyse, abstract and publish statistical information relating to the commercial, industrial, financial, social, economic, and general activities and
condition of the people. Those duties include producing gross domestic product and other topical economic data, as well as current high-quality data on key areas of social policy concern including employment, education, health, and justice. Planned activities
|
| Continue to renew statistical programs | Ongoing | Economic Statistics | Relevance Trust Efficiency |
Statistics Canada is responsible for producing relevant and high-quality statistics. Canada and the world continue to evolve. To ensure trust in our statistical programs, the agency must also evolve to stay relevant and maintain their quality. It is a priority to update our programs to reflect the changing reality of Canada’s economy and society while ensuring their quality and
continuity. Planned activities
|
Planned activity: Deliver timely and accurate economic indicators
Producing gross domestic product (GDP) data is one of Statistics Canada’s key activities, given the central role of these data in the management of Canada’s economy. Other key activities contribute to the calculation of the GDP, such as the Balance of International Payments; the Survey of Employment, Payrolls and Hours; the Quarterly Survey of Financial Statements; the consumer and industrial price indexes; international trade statistics; the Monthly Wholesale Trade Survey; the Monthly Retail Trade Survey; and tax files from the Canada Revenue Agency. These GDP-related activities will continue, and will continue to be important.
Another key activity is the production of Consumer Price Index (CPI) data, which are also central to managing Canada’s economy. CPI activities will continue, and will remain key.
Specifically ongoing
- Conduct the monthly and annual surveys on the economy, to be used in the compilation of the GDP and production of the suite of economic indicators.
- Publish the suite of economic indicators such as retail sales, international imports and exports, manufacturing shipments, and GDP on monthly and quarterly bases within two months of the reference period.
- Perform monthly collection activities for data to be used in the compilation of the CPI.
- Publish the CPI monthly, within three weeks of the reference period.
Planned activity: Renew the System of National Accounts
The products and industries of the Canadian and world economy continue to evolve. In particular, the services sector is growing relative to the goods-producing sector. In addition, knowledge-based industries and products are gaining importance. Statistical programs must also evolve: over the next two years, the National Accounts program will update its measures of economic activity in accordance with new standards issued by the IMF, OECD and UN.
Information on the government sector will also be revised in light of the broad adoption of new public sector accounting standards in recent years. The updated National Accounts will provide better information on the financial sector in light of recent economic events, and will prepare to make further improvements based on recommendations still being formulated by the G20 and other international bodies.
A key objective of the renewal is ensuring that Canadians have access to comparable economic data across provinces and nations.
Specifically
2011/2012
- Establish new structure for national accounts products and define new outputs.
- Prepare documentation of changes to concepts, structure and outputs.
- Inform users of the changing structure and output and help them prepare for the release of the new estimates.
2012/2013
- Publish new estimates via a series of updated releases through the year.
- Ensure users can properly incorporate the new estimates for their data needs, in particular for official uses such as Equalization and HST allocation.
Planned activity: Modernize the government finance statistics program
Statistics Canada publishes a comprehensive set of government finance statistics. They encompass all levels of government by converting disparate sets of financial statements into one coherent set of financial accounts. This enables comparability of government finances across jurisdictions. The revenue statistics from this program are used in the equalization program of the Fiscal Arrangements Act to calculate the representative tax bases. The accounting basis for these data has, however, become out of date relative to modern accounting practices and is being phased out. A new international standard, developed by the IMF, will be fully in place by 2014. By June 2012, data for the Fiscal Arrangements Act will move to the new standard. The remainder of the data program, used by governments for analytical and forecasting purposes and to report to international agencies like the IMF and OECD on expenditures by function of government (health, education, etc.), will be implemented by 2014.
Specifically
2011/2012
- Document and implement the first phase of the new IMF standard.
- Provide outreach and training on the new accounting standards and classification to key stakeholders.
- Develop a quality assurance process for data to be provided for the Fiscal Arrangements Act.
- Finalize the publication schedule for the remainder of the data program.
Planned activity: Enhance the Consumer Price Index to better reflect current consumer spending patterns
Under the current four-year renewal cycle, the basket weights used in the CPI for the 2005 reference year will be replaced with weights based on 2009 consumer spending patterns. This update, planned for June 2011, will refresh the index to better reflect more current purchasing patterns and economic conditions.
Specifically
2011/2012
- Incorporate the 2009 weighting patterns into the CPI.
- Analyse changes in spending patterns between 2005 and 2009.
- Introduce the 2009 weighting pattern in the CPI May 2011 reference month.
- Review the sample of points of purchase for the goods and services used to calculate the CPI.
- Increase the product sample of the CPI to better reflect the price paid by Canadians for goods and services they purchase.
Planned activity: Reflect changes to Canadian accounting standards in survey programs
On January 1, 2011, Canada officially replaced Generally Accepted Accounting Principles (GAAP), the accounting standard that had been authorized by the Canadian Institute of Chartered Accountants, with International Financial Reporting Standards (IFRS). Transitioning companies are required to produce parallel financial statements using GAAP and IFRS standards in the year preceding their formal transition to IFRS. Planned initiatives will use this information to explain the impact of the transition on enterprise-level financial statements, economy-level aggregates and the quarterly enterprise financial data series. This work may also identify requirements to modify the Quarterly Survey of Financial Statements questionnaires and systems, and may yield recommendations to change the Chart of Accounts.
Specifically
2011/2012
- In 2010/2011, two short supplements were added to the Quarterly Survey of Financial Statements. The first supplement was used to ask whether and when a company would adopt IFRS and whether adopting it would lead to a change in the corporate entities included in an enterprise’s consolidated financial statements.
- In 2011/2012, use the second supplement to collect key data according to IFRS and GAAP standards for comparison at micro and macro levels (by industry as well as by financial and non-financial sector).
Benefits for Canadians
An effective, well-developed economic and environmental statistics program is important for Canadian businesses, workers, governments, and other institutions. They can use it as a baseline against which they can measure the performance of the economy and of their own and collective undertakings. This program is central to Canada’s participation in international institutions such as the IMF, OECD, World Trade Organization and UN. International co-ordination of economic policy and effective trade negotiations depend on statistical information.
Beginning with the Constitution Act of 1867, much Canadian legislation at the federal and provincial levels has relied on statistical information to operate. Equalization payments to provinces and indexation of social benefits and tax brackets are important examples of legislated uses of economic statistics. In the private sector, many contracts and collective agreements are similarly dependent on economic statistics.
The current economic climate illustrates well the dependence of macro-economic fiscal and monetary policy on economic statistics. Equally important and similarly dependent on economic statistics are industrial and labour market policies, regional economic policy, productivity and innovation policies, and policies designed to attract and retain foreign investment in Canada. Environmental statistics provide data on the impacts on the environment of human activity, and shed light on the interaction of policy initiatives and environmental issues.
Private businesses, like governments, depend on economic statistics for their decisions on such things as investments, market analysis, opening and closing locations, and mergers and acquisitions. Timely and reliable statistics reduce uncertainty about the economy and environment, and make private decision-making more efficient.
2.2 Social Statistics
| Human resources (FTEs) and planned spending (thousands of dollars) | |||||
|---|---|---|---|---|---|
| 2011/2012 | 2012/2013 | 2013/2014 | |||
| FTEs | Planned spending | FTEs | Planned spending | FTEs | Planned spending |
| 1,565 | 138,951 | 1,579 | 138,794 | 1,590 | 138,794 |
| Program Activity expected results | Performance indicators | Targets |
|---|---|---|
| Statistics produced by Statistics Canada are available through a wide range of easily accessible media formats and venues. | Number of page views of electronic publications (’000) | Annual increase exceeds 5% |
| Annual percentage increase in the number of page views of electronic publications | ||
| Success in finding information on the Statistics Canada website | 65% of visitors surveyed found what they were looking for | |
| Ease of finding information on the Statistics Canada website | 70% of visitors surveyed would say they were satisfied | |
| Canadians are aware of the availability of these statistics and of their high quality, and of the professionalism and non-partisanship of Statistics Canada. | Number of data series downloaded from the CANSIM online database (’000) | Annual increase in downloaded series exceeds 5% |
| Annual percentage increase in the number of data series downloaded from the CANSIM online database (%) | ||
| Client satisfaction with Statistics Canada’s ability to meet their needs | Rating of 4 out of 5 | |
|
Percentage of statistical outputs that meet set levels of accuracy |
95% of major statistical outputs meet set levels of accuracy | |
| Notes Please note that the planned spending figures presented above are net of respendable revenue and are derived by taking the gross figure from the ‘Planning Summary’ table, less planned respendable revenue from the ‘Sources of Respendable and Non-Respendable Revenue’ table. Totals may differ between tables because of rounding. Definitions Number of page views of electronic publications: The number of web pages viewed during visitor sessions on the Statistics Canada website. Client satisfaction: These data are derived from the client satisfaction surveys conducted by the Social Statistics program activity. The surveys use measures that are consistent with the common measurement tool in use across the federal government. Data series downloaded from the online database: Data series downloaded by external users from CANSIM, Statistics Canada’s online database. Major statistical outputs whose sampling accuracy is within set objectives: Most surveys are based on statistical sampling. Sampling is an important means of achieving timely and cost-effective results. At the same time, estimates based on sampling can be expected to vary from sample to sample, and to differ from those that would result from a complete census. Sampling accuracy objectives are set on a survey-by-survey basis. Success in finding information on the Statistics Canada website: Users are asked to indicate whether they successfully located the information they were seeking in their current visit to the Statistics Canada website. This feedback is collected in the Web Evaluation Survey conducted annually by Statistics Canada. An invitation to participate in the survey appears as users view the site pages. Ease of finding information on the Statistics Canada website: Users are asked to rate, on a five-point scale ranging from very easy to very difficult, how easily they found the information they were seeking in their current visit to the Statistics Canada website. This feedback is collected in the Web Evaluation Survey conducted annually by Statistics Canada. An invitation to participate in the survey appears as users view the site pages. |
||
Program activity description
The Social Statistics program offers information to decision makers and to all Canadians on the economic and social characteristics of individuals, families, and households in Canada, and on the major factors that contribute to their well-being. Social Statistics measures household income and expenditure; employment, unemployment, and their associated costs and benefits; labour income and factors affecting labour supply; and ethnocultural diversity as well as general social conditions and well-being. The Social Statistics program also offers information on topics of specific social policy concern. It covers the justice, health care, and education systems as well as cultural institutions and industries—the nature and extent of their services and operations, the outcomes of the services they provide, and the characteristics of the individual Canadians and families whom they serve.
Relevant information is information that responds to Canada’s evolving and highest priority needs. Without renewal, the relevance of official statistics runs the risk of diminishing over time as the needs of government and its citizens change. To ensure relevance, continuous dialogue with stakeholders is needed to identify emerging information needs and to adapt existing programs to meet them.
An ongoing threat to the quality of social statistics is the increasing difficulty of collecting that information. One significant factor is that technology advances are making respondents harder to reach. Call display and call screening hinder the agency’s ability to get a respondent to answer the telephone. As well, more households have only cellphones or use Internet phones. All of this makes it more challenging to maintain representative samples and response rates. Without further efforts in survey collection, relevance and quality will decline.
The widespread adoption of Internet technologies creates an opportunity to reach Canadians in new ways. To maintain quality, manage survey costs, and satisfy demands for greater access to data, Statistics Canada is modernizing the infrastructure it uses to collect and disseminate data.
A more detailed description of this program activity and planned release dates can be found at: http://www.statcan.gc.ca/about-apercu/structure/paa-aap-eng.htm and http://www.statcan.gc.ca/release-diffusion/index-eng.htm.
Priorities
Table 8 provides a summary of the priorities of the Social Statistics program activity.
| Priority | Type | Link to Program Activity | Contribution to the strategic outcome and planned activities | Why is this a priority? |
|---|---|---|---|---|
| Operational priorities | ||||
| Deliver ongoing economic and social statistics programs | Ongoing |
Social Statistics |
Relevance |
Statistics Canada’s strategic outcome is to ensure that Canadians have access to a trusted source of statistics meeting their highest priority information needs. The Statistics Act directs the agency to collect, compile, analyse, abstract and publish statistical information relating to the commercial, industrial, financial, social, economic and general activities and
condition of the people. Those duties include producing gross domestic product and other topical economic data, as well as current high-quality data on key areas of social policy concern including employment, education, health and justice. Planned activities
|
| Continue to renew statistical programs | Ongoing | Social Statistics | Relevance Trust Efficiency |
Statistics Canada is responsible for producing relevant and high-quality statistics. Canada and the world continue to evolve. To ensure trust in our statistical programs, the agency must also evolve to stay relevant and maintain their quality. It is a priority to update our programs to reflect the changing reality of Canada’s economy and society while ensuring their quality and
continuity. Planned activities
|
Planned activity: Deliver ongoing key social statistics programs
The Social Statistics program strives to ensure relevant, quality outputs through program renewal, including the activities described below. The program also delivers a broad, comprehensive set of survey and administrative data development activities.
Specifically
2011/2012
- Continue to deliver the Social Statistics program, including household surveys such as the Labour Force Survey and other surveys yielding trends on family income and expenditure, as well as establishment-based employment surveys.
- Produce information and analytical outputs on key social issues, including immigration, ethnicity, social engagement, youth, families, criminal victimization, gender, seniors, and social well-being. Data are from the General Social Survey, the Longitudinal Immigration Database, and post-censal surveys.
- Produce information related to inputs, outputs and outcomes from the education system through a mix of household surveys, provincial and territorial sources, and data obtained from postsecondary institutions.
- The Canadian Centre for Justice Statistics will continue to be the focal point of a federal-provincial-territorial partnership for collecting information on the nature and extent of crime and the administration of civil and criminal justice in Canada.
- Provide statistical information and analysis about the state of Canadians’ health through the ongoing Canadian Community Health Survey and the Canadian Health Measures Survey, as well as occasional surveys such as the Health Services Access Survey and the Joint Canada/US Survey on Health. Maintain Canada’s vital statistics and the Canadian Cancer Registry.
- Produce flagship publications such as Canadian Social Trends and Perspectives on Labour and Income.
Planned activity: Increase support of key policy needs and initiatives
Statistics Canada is developing, in collaboration with stakeholders, information roadmaps to respond to emerging data needs in key areas of social policy such as justice, the labour market, and wealth. These roadmaps show what is needed to address areas where data are incomplete or fragmented, and where investments are needed to support future policy needs and initiatives.
Specifically
2011/2012
- A Justice Information Roadmap is being developed in collaboration with key stakeholders in provincial and territorial governments, as well with Justice Canada and Public Safety Canada. The roadmap will present a vision for a national justice information system and will identify what resources will be required to achieve this vision. It includes an overview of key information needs and current data gaps to be filled in order to meet the current and future data requirements of policy makers in the justice area.
- Work will continue with Human Resources and Skills Development Canada on a more flexible and responsive approach to meet their data needs. Various options are being developed and work will continue on implementation.
- Continue the development of a framework for education statistics in Canada. Provincial and territorial ministers have indicated that the implementation of a survey on Program of International Assessment of Adult Competencies is one key activity among others.
Planned activity: Begin the Labour Force Survey redesign
The Labour Force Survey (LFS) is one of the key activities at Statistics Canada, given the central role of the data in the management of Canada's economy. This survey is the source of widely-used statistics such as the official unemployment rate. LFS data, the first of Statistics Canada’s socioeconomic statistics to be published each month, are highly relevant for determining the direction of the economy and the effect of changing economic conditions on Canadians. In particular, the Employment Insurance Act has designated the LFS as the source of monthly unemployment rates used in the administration of the Employment Insurance Program. Approximately $8 billion per year are transferred to individuals on the basis of these rates.
Every 10 years following a census, a redesign of the LFS is essential in order to maintain its relevance and quality. A review is currently underway to determine the scope of the next redesign to ensure the continued reliability of these key statistics. The LFS systems will be in scope for this redesign as they have not been updated since the early 1990s. Aging of these systems introduces an increasing risk that Statistics Canada’s ability to release employment and unemployment estimates in its current timely fashion may be compromised.
Specifically
2011/2012
- Given the complexity of the current LFS systems and the interdependence among these various systems, a feasibility study will be undertaken to understand the various common tools and the new social survey processing environment to determine how they need to be adapted to meet LFS business requirements.
- A roadmap will be developed for migrating the existing LFS systems and requirements to the corporate common tools environment.
- Resource requirements will be determined for the coming years for moving the LFS to a common processing environment.
2012/2013
- The strategy for the redesign will be implemented over a two-year period, including consultations, content and systems development and testing.
Planned activity: Prepare for the 2012 Survey of Financial Security
Statistics Canada provides continuous excellent coverage of income and expenditure data. The measurement of a family’s wealth through the collection of information on net worth, or assets minus debts is less frequent. Wealth has been identified as an important statistical data gap to effectively discuss issues related to pension and income replacement, with a number of countries implementing a wealth survey as part of their regular program.
Statistics Canada conducted the first Survey of Financial Security (SFS) in 1999, providing a comprehensive picture of the net worth of Canadians. Information was collected on the value of all major financial and non-financial assets as well as debt held on mortgages, vehicles, credit cards, student loans and others.
Since these data were last collected in 2005, there have been significant changes in the economy, investment options and strategies and the tax system that are likely to have had an impact on the net worth positions of households. To provide up-to-date information on the net worth of Canadian households, Statistics Canada will be conducting the next Survey of Financial Security in the spring of 2012.
Specifically
2011/2012
- Consultation of key stakeholders will be conducted early in 2011/2012 to finalize the content of the 2012 SFS. While there is some scope for updating the survey content, the focus will be on producing estimates comparable to those from the previous two iterations of the survey.
- All materials and systems related to the collection of the survey will be developed so as to be ready for the collection of the data in April 2012.
- The processing strategy will be developed and preliminary plans for dissemination of the data from the 2012 survey will be developed.
2012/2013
- The Survey of Financial Security is planned to be conducted in April to June 2012. The data will then be processed and plans for dissemination finalized, leading to the release of the data in 2013/2014.
Planned activity: Pilot online data reporting for household surveys
Experience with the 2006 Census of Population and other surveys has shown a growing interest in the use of an Internet survey response option. This interest, along with the potential for cost savings efficiencies in data collection, has led to exploring the Internet as an option for household survey respondents.
The Labour Force Survey (LFS) will be the first major household survey to introduce an Internet option. A prototype Internet application will be used to provide approximately 6,000 households with the option to complete the LFS online in a pilot test in 2011. A high take-up rate of respondents entering their information directly online for the LFS, and for other household surveys in the future, could produce collection efficiencies and data quality improvements in coming years.
Specifically
2011/2012
- Evaluate the prototype of an online household survey response application.
- Conduct a pilot test of the LFS questionnaire including an online option.
- Analyse the results of the pilot test.
2012/2013
- Integrate the online response option into main LFS activity.
- Using lessons learned from the LFS, develop Internet response options for other household surveys.
Planned activity: Expand the use of administrative data for statistical purposes
Technological advances have facilitated and reduced the cost of manipulating large administrative files in recent years. The renewed interest in administrative records stems largely from tightening budgets which have led to a search for alternatives to the relatively expensive collection costs of statistical surveys and censuses. There is also recognition of the resulting reduction in respondent burden should administrative files be used in lieu of surveys, though the privacy implications are also in the forefront of this debate. Finally, the increasing demand for small area data which cannot usually be obtained from sample surveys encourages the examination of administrative records as an alternate source of such data.
Administrative data files are now being used in several social statistical programs, including provincial and territorial vital statistics registries, education, health and justice administrative files, and federal administrative data on immigration and income tax.
Specifically
2011/2012
- Using the Longitudinal Health Administrative Database, examine access to services for immigrants to Canada.
- Add the cancer stage to the Canadian Cancer Registry for common cancers, in co-operation with provincial cancer registries and the Canadian Partnership Against Cancer.
- Explore the potential to produce more small area data and develop new research venues by linking the data to other surveys or administrative sources.
- Conduct a feasibility study to make better use of the Longitudinal Immigration Database for statistical purposes.
Benefits for Canadians
Relevant, timely and accurate information on a broad range of social issues provides decision makers at all levels of government, and in non-government organizations, as well as academics with essential information for developing policies, managing programs, conducting research, and making decisions that affect individuals, families and households in Canada. The Social Statistics program provides objective statistical information on topics that respond to Canada’s evolving and highest priority data needs.
Social policy and program development are supported through the statistical analysis of social and socio-economic characteristics of individuals, families and households in Canada, and on the major factors that can contribute to their well-being.
This includes measures of Canada’s ethnocultural diversity, through the lens of first- and second-generation Canadians as well as those whose ancestors have been in this country for three generations or more. Subgroups of the population such as recent immigrants, visible minorities, Aboriginal peoples and minority-language groups also contribute to Canada’s ethnocultural diversity. Analysing the socio-economic status of these groups includes measuring their household income and expenditure, their employment and unemployment, and factors affecting the labour supply. The Survey of Financial Security is being repeated to address a need for more comprehensive data on their income and wealth. Data on labour and income contribute to the System of National Accounts, including labour income, monthly GDP, and productivity.
The Social Statistics program also provides information and analysis on the facilities, agencies and systems that are publicly funded to meet the socio-economic and physical needs of Canadians, and on the outcomes of the services that they provide. It covers the justice, health care, and education systems as well as cultural institutions and industries. The program measures the nature and extent of their services and operations, and the characteristics of the individual Canadians and families whom they serve.
To ensure continuing relevance, the program has a continuing dialogue with stakeholders to identify emerging information needs and to adapt existing programs to meet them. Adapting to new technologies, such those being made possible by the Internet, is also important for both data collection and access to outputs. The upcoming redesign of the Labour Force Survey touches on all of these elements.
2.3 Census, Demography and Aboriginal Statistics
| Human resources (FTEs) and planned spending (thousands of dollars) | |||||
|---|---|---|---|---|---|
| 2011/2012 | 2012/2013 | 2013/2014 | |||
| FTEs | Planned spending | FTEs | Planned spending | FTEs | Planned spending |
| 1,722 | 334,905 | 992 | 66,229 | 535 | 28,966 |
| Program Activity expected results | Performance indicators | Targets |
|---|---|---|
| Statistics produced by Statistics Canada are available through a wide range of easily accessible media formats and venues. | Number of page views of electronic publications (’000) | Annual increase exceeds 5% |
| Annual percentage increase in the number of page views of electronic publications (%) | ||
| Success in finding information on the Statistics Canada website | 65% of visitors surveyed found what they were looking for | |
| Ease of finding information on the Statistics Canada website | 70% of visitors surveyed would say they were satisfied | |
| Canadians are aware of the availability of these statistics and of their high quality, and of the professionalism and non-partisanship of Statistics Canada. | Number of data series downloaded from the CANSIM online database (’000) | Annual increase in downloaded series exceeds 5% |
| Annual percentage increase in the number of data series downloaded from the CANSIM online database (%) | ||
| Client satisfaction with Statistics Canada’s ability to meet their needs | Rating of 4 out of 5 | |
| Net undercoverage for 2011 Census of Population | Less than 3% | |
| Response rate for 2011 Census of Population | 98% or more | |
| Response rate for National Household Survey | At least 50% | |
| Organizational efficiency | Cost per dwelling for 2011 Census of Population | Less than $42 |
| Notes The planned spending figures presented above are net of respendable revenue and are derived by taking the gross figure from the ‘Planning Summary’ table, less planned respendable revenue from the ‘Sources of Respendable and Non-respendable Revenue’ table. Definitions Number of page views of electronic publications: The number of web pages viewed during visitor sessions on the Statistics Canada website. Data series downloaded from the online database: Data series downloaded by external users from CANSIM, Statistics Canada’s online database. Net census undercoverage: The number of people missed less the number of people counted more than once. Following each census since the 1961 Census, the reverse record check (RRC) has been carried out to measure census population undercoverage. The RRC estimates the number of people missed in the census. This estimate is combined with the estimate from the census overcoverage study of the number of people enumerated more than once to calculate net undercoverage. Response rate: The accuracy of the data disseminated by Statistics Canada is directly related to the accuracy of the data provided by the respondents to its surveys or censuses. It follows that an important indication of accuracy is the percentage of respondents asked to provide data who actually do so. Generally, the higher the response rate, the greater the accuracy of the census results. Cost per dwelling: This refers to the total number of dwellings projected in Canada for the census divided by the total cost estimate. Success in finding information on the Statistics Canada website: Users are asked to indicate whether they successfully located the information they were seeking in their current visit to the Statistics Canada website. This feedback is collected in the Web Evaluation Survey conducted annually by Statistics Canada. An invitation to participate in the survey appears as users view the site pages. Ease of finding information on the Statistics Canada website: Users are asked to rate, on a five-point scale ranging from very easy to very difficult, how easily they found the information they were seeking in their current visit to the Statistics Canada website. This feedback is collected in the Web Evaluation Survey conducted annually by Statistics Canada. An invitation to participate in the survey appears as users view the site pages. |
||
Program activity description
The Census, Demography and Aboriginal Statistics program produces statistical information on Canada’s population, its demographic characteristics and conditions, and how these change over time. The program also conducts the Census of Agriculture, and provides information on the socioeconomic conditions and well-being of Aboriginal peoples.
Census: The key activities are the quinquennial Census of Population and Census of Agriculture and the new voluntary National Household Survey (NHS). The Census of Population produces population counts and estimates, which are needed to determine electoral boundaries, the distribution of federal transfer payments, and the transfer and allocation of funds among regional and municipal governments, school boards, and other local agencies within provinces and territories. The voluntary NHS will replace the mandatory long-form census: it will be conducted using the census infrastructure.
Most countries regularly carry out a census to collect key information about the social and economic situation of the people living within its boundaries. In Canada, the census/NHS program does that, and is also the only source of detailed data for small groups (such as lone-parent families, ethnic groups, industrial and occupational categories, and immigrants) and for areas as small as a city neighbourhood.
Statistics Canada extensively reviewed census processes following the 2006 Census. These reviews identified opportunities for streamlining operations for the 2011 Census and beyond. The Internet response option, introduced in 2006, was extremely successful: Statistics Canada is taking measures to encourage Canadians to use it, to an even greater extent, for the Census and the NHS in 2011.
In addition to those measures, systems and processes are being developed to address operational issues encountered in 2006. Changes are being made to improve data processing and system maintenance. The goal is to streamline future operations by integrating with the ongoing collection infrastructure and by ensuring that the NHS leverages the census infrastructure as much as possible.
The Census of Agriculture produces and publishes economic series on the agriculture sector. These series serve as a benchmark for the annual estimates that flow to the System of National Accounts to form the agriculture component of the gross domestic product, satisfying the requirements of the Fiscal Arrangements Act. The Census of Agriculture provides a comprehensive picture of the agriculture sector at the national, provincial, territorial, and sub-provincial levels, and is mandated by the Statistics Act.
Demography: The demography program enables Statistics Canada to meet its legal obligation to provide annual population estimates, certified by Canada’s chief statistician. The estimates are used to determine what amounts are payable according to the Federal–Provincial Fiscal Arrangements Act and in Territorial Formula Financing. Population estimates are necessary for the Canada Pension Plan Act, the Canada Pension Plan Investment Board Act, the Canada Student Loans Act and the Canada Student Financial Assistance Act. The estimates are produced at many levels of geographic detail—Canada, the provinces and territories, and sub-provincial—that include census divisions, census metropolitan areas, and economic regions. Additionally, demographic projections are prepared after each census to help, for example, develop programs and policies on aging and to plan and predict pensions and the labour market. Estimates and demographic projections are used by all levels of government, the private sector, researchers, and non-governmental organizations.
Aboriginal statistics: The Aboriginal statistics component of the program activity provides subject matter expertise, co-ordination and integration in the collection, analysis and dissemination of data about Aboriginal people on topics such as education, use of Aboriginal languages, labour activity, income, health, communication technology, mobility, and housing conditions. In this capacity, it provides information, support, and advice to federal departments as well as Aboriginal governments and organizations. The program also includes a statistical training program to build statistical skills and knowledge among Aboriginal organizations and communities, as mandated by the federal government in 1999 through its Aboriginal action plan, Gathering Strength.
The data available for Aboriginal peoples are not timely and are incomplete compared with the data for the general population. The Census of Population and National Household Survey paint a broad picture: however, more in-depth data from on-reserve Aboriginal-specific surveys are needed to understand determinants and consequences of changes in areas such as early childhood development, work, education, health, and housing.
To fill the substantial data gaps regarding the on-reserve First Nations population, Statistics Canada will to continue to work with other federal government departments and with Aboriginal communities and organizations.
A more detailed description of the Census, Demography and Aboriginal Statistics program, as well as planned release dates can be found at: http://www.statcan.gc.ca/about-apercu/structure/paa-aap-eng.htm and http://www.statcan.gc.ca/release-diffusion/index-eng.htm.
Priorities
Table 10 summarizes the priorities of the Census, Demography and Aboriginal Statistics program activity.
| Priority | Type | Link to Program Activity | Contribution to the strategic outcome and planned activities | Why is this a priority? |
|---|---|---|---|---|
| Operational priorities | ||||
| Conduct the Census of Population, the Census of Agriculture, and the National Household Survey | Ongoing | Census, Demography and Aboriginal Statistics | Relevance Trust Access |
Statistics Canada is mandated by legislation to perform a census every five years: 2011 is the year of data collection for the Censuses of Population and Agriculture. These data, along with the data being collected in the new National Household Survey, will produce a statistical portrait of both the Canadian population and of Canada’s farms and their operators. The data are
widely used by all levels of government for policy planning and program development and delivery. Planned activities
|
| Continue to renew statistical programs | Ongoing | Census, Demography and Aboriginal Statistics | Relevance Trust Efficiency |
Statistics Canada is responsible for producing relevant and high-quality statistics. Canada and the world continue to evolve. To ensure trust in our statistical programs, the agency must also evolve to stay relevant and maintain their quality. It is a priority to update our programs to reflect the changing reality of Canada’s economy and society while ensuring their quality and
continuity. Planned activities
|
Planned activity: Conduct the 2011 Census of Population and the National Household Survey
The Constitution Act of 1867, as well as the Statistics Act, requires that a Census of Population be held in Canada in 2011. The census collects population and dwelling counts as well as population information such as age, sex, common-law and marital status, first language learned in childhood, home language and knowledge of official languages. The NHS collects information on mobility, ethnocultural identity (including Aboriginal peoples and languages), labour, education, income, citizenship, immigration, transportation and housing.
The Census and the NHS produce a demographic snapshot of the population, and are the only source of coherent and detailed information for small geographic areas. In addition, census counts are critical to the production of inter-censal population estimates, which are updated after each census.
The data are used by all levels of government for policy planning and program development and delivery. The federal government distributes billions of dollars annually in federal transfers to provinces and territories using population estimates—more than $65 billion has been planned for 2010/2011. The key components of these distributions are the Canada health and social transfers, territorial formula financing, and equalization payments. Decennial census data are also used to determine the number and boundaries of federal electoral ridings for representation in the House of Commons.
Statistics Canada painstakingly assesses, modifies, and tests statistical and operational procedures for the NHS to minimize non-response bias and to achieve the best quality results possible. Only when data collection is complete will data quality assessment begin. A number of measures will be used, including comparing NHS data to 2006 Census long form and 2011 Census short form data. The immediate priority is scaling up systems and operations in preparation for data collection activities for both the 2011 Census and NHS.
Specifically
2011/2012
- Complete recruitment and training of approximately 35,000 field and processing staff.
- Implement a public communications program.
- Complete collection operations and process questionnaire returns.
- Start data quality studies.
- First release of the 2011 Census, Population and Dwelling Counts, in February, 2012.
2012/2013
- Complete processing of census returns and continue data quality studies.
- Disseminate census and NHS results.
- Complete evaluation of lessons learned from 2011 Census and NHS.
Planned activity: Conduct the 2011 Census of Agriculture
The Census of Agriculture is conducted to develop a statistical portrait of Canada's farms and their operators. The data offer a full picture of the major commodities of the agriculture industry, farm finances, use of technology, and new or less common crops and livestock. The next Census of Agriculture will be conducted in May 2011, concurrent with the Census of Population. Significant savings can be realized by sharing common processes and systems, such as printing, communications, collection, questionnaire scanning and capture. A full mail-out/mail-back collection methodology will be implemented for the Census of Agriculture in 2011: follow-ups will be conducted by a centralized telephone operation. Along with data collection, data processing and data validation will be conducted in 2011/2012. Data will be released on May 10, 2012.
The immediate priorities are the 2011 Census collection and processing operations.
Specifically
2011/2012
- Implement a public communications program.
- Complete collection operations and process questionnaire returns.
- Start data quality studies.
2012/2013
- Disseminate Census of Agriculture results.
- Complete evaluation of lessons learned from 2011 Census of Agriculture.
Planned activity: Evaluate new methodologies for the 2016 censuses
Censuses of population are conducted in various forms around the world. While many countries continue to use the traditional approach of collecting information from every household, some trace a portrait of their population by assembling data from various administrative files. France uses a rolling census approach; others use combinations of these models. In Canada, a detailed review of the methodological approaches for the next census is always conducted as part of the post-census process. The next review will take into account the move from a long-form census to a voluntary National Household Survey. In doing so, Statistics Canada will review methodological approaches used abroad and their applicability to the Canadian context. The approach used in the Census of Agriculture will also be reviewed. As part of the exercise, the agency will examine the legal requirements to conduct a census and the criteria used to determine census content. This work will be the basis for developing the proposal that will be presented to the government on the methodology to be used for the 2016 Census and beyond.
Specifically
2011/2012
- Identify constitutional and statutory requirements for the 2016 censuses.
- Review different methodological approaches to conducting censuses.
- Consult key stakeholders on issues of data relevance, data access, and privacy.
- Develop options on methodologies for the 2016 censuses.
2012/2013
- Prepare the detailed proposal on the methodology for the 2016 censuses.
Planned activity: Study the feasibility of using income tax data for future censuses of agriculture
When Treasury Board approved funding for the full cycle of the 2011 Census of Agriculture in April, 2008, included was a strategic investment project to assess the feasibility of using tax data to replace the financial data currently being collected from respondents. The assessment will link respondent-provided 2011 Census of Agriculture financial data with the data on their agricultural operations filed with the Canada Revenue Agency. The project’s results will serve as a basis for determining the financial content and methodology for the 2016 Census of Agriculture.
Specifically
2011/2012
- Building on the studies begun with the 2009 Census Test, use 2011 Census of Agriculture data to further refine linkage methodologies and analysis on the coherence and compatibility of census data with tax data, and determine the impact of using tax data replacement.
2012/2013
- Make recommendations on and begin to define how tax data would be used to replace financial data in future censuses of agriculture.
Benefits for Canadians
Census and NHS programs
Decennial census data are constitutionally required for determining the number and boundaries of federal electoral districts.
Further, the demographic, social and economic data that the Census and NHS programs collects on the Canadian population are needed to meet the priority information needs of government and the private sector. The Census and NHS programs provide unique and essential data to support
- learning about populations that are key targets of government policy (e.g., recent immigrants; visible minorities; people with disabilities; Aboriginal peoples, including First Nations communities; ethnic, religious and language minorities; seniors and youth)
- provincial/territorial and local government planning and program delivery, which provides detailed small-area information to monitor progress on issues such as rural population decline, infrastructure investments by all levels of government and the changing makeup of neighbourhoods
- designing surveys that provide estimates of monthly employment, family incomes and expenditures, as well as other topics of concern to government, industry, labour and the general public
- analysing social and economic issues, such as the skills shortage and integrating immigrants
- reviewing the effectiveness of current legislation.
Demography statistics
During the intercensal period, population estimates are required to meet various legislative requirements, such as the Canada Health Transfer, the Canada Social Transfer, the Wait Times Reduction Transfer, the Equalization Formula and Territorial Formula Financing. These transfers together amounted to more than $65 billion in 2010/2011. Population estimates are produced annually and quarterly by province and territory. Demographic projections are derived every five years, following the census. Various assumptions on population fertility, mortality and migration are used to define multiple potential growth scenarios.
Aboriginal statistics
Results from Aboriginal Peoples surveys will complement Census and NHS data, providing a snapshot of the socioeconomic, cultural and health conditions of Métis, Inuit, and First Nations people living off-reserve and in the North.
Significant data gaps exist, however, for the First Nations population living on-reserve. Statistics Canada is working with key stakeholders to develop strategies to address these gaps.
Census of Agriculture
Direct federal and provincial payments to the agriculture sector have totalled approximately $4 billion annually in recent years. The Census of Agriculture is critical for developing and evaluating programs and policies related to food supply and safety, the environment, renewal, science and innovation, and business risk management. It contributes, both directly with data and indirectly by supporting the annual agricultural statistics program. The Census of Agriculture provides a comprehensive source of data that is the foundation for the analysis of the agriculture and agri-food industry done by federal and provincial departments.
Beyond those federal and provincial departments, Census of Agriculture data are used by provincial, territorial and municipal governments, local-level organizations and agencies (e.g., conservation authorities), farmers’ associations (e.g., the Canadian Federation of Agriculture and the National Farmers Union), academics (e.g., sociologists, economists and agronomists), specialized agriculture media, and the general media.
2.4 Internal Services
| Human resources (FTEs) and planned spending (thousands of dollars) | |||||
|---|---|---|---|---|---|
| 2011/2012 | 2012/2013 | 2013/2014 | |||
| FTEs | Planned spending | FTEs | Planned spending | FTEs | Planned spending |
| 908 | 82,637 | 914 | 82,626 | 919 | 82,626 |
| Program Activity expected results | Performance indicators | Targets |
|---|---|---|
| Organizational efficiency | Rating on 21 areas of management, as defined in the Management Accountability Framework | Obtain rating of ‘strong’ or ‘acceptable’ in 90% of areas of management |
| Financial reports to Policy Committee provided as planned | Monthly | |
| Departmental Staffing Accountability Report | Rank in the top quartile of agencies and departments (response rates and overall results) | |
| Notes Please note that the planned spending figures presented above are net of respendable revenue and are derived by taking the gross figure from the ‘Planning Summary’ table, less planned respendable revenue from the ‘Sources of Respendable and Non-Respendable Revenue’ table. Totals may differ between tables because of rounding. Definitions Management Accountability Framework (MAF): This annual evaluation of departments conducted by the Treasury Board Secretariat measures 21 areas of management. This independent evaluation is an indicator of the efficiency of an organization’s modern management practices. Financial reports to Policy Committee provided as planned: Reporting by the agency’s financial management services to the agency’s executive committee. This is scheduled to occur monthly . Departmental Staffing Accountability Report (DSAR): An annual report provided by organizations to the Public Service Commission concerning the management and results of departmental/agency staffing. |
||
Program activity description
Internal Services is made up of activities and resources that support programs and other corporate obligations: management and oversight services; communications services; legal services; human resource management services; financial management services; information management services; real property services; materiel services; acquisition services; and travel and other administrative services.
Priorities
Table 12 provides a summary of the priorities of the Internal Services program activity.
| Priority | Type | Link to Program Activity | Contribution to the strategic outcome and planned activities | Why is this a priority? |
|---|---|---|---|---|
| Management priorities | ||||
| Improve the agency’s business processes and further integrate its results-based corporate infrastructure | Ongoing | Internal Services | Relevance Trust Access Efficiency |
Improve the effectiveness and efficiency of corporate business processes, and further integrate human resource planning, informatics technology, and program and project planning: these are required to ensure the agency remains relevant and accountable over the long term. Planned activities
|
Planned activity: Further integrate risk management, planning and evaluation activities
Risk management has become increasingly important at Statistics Canada as the agency strives to provide Canadians with access to a trusted source of statistics that meets their highest priority information needs. A senior management committee has been formed to help integrate risk management into departmental management practices and decision-making. Statistics Canada is identifying and articulating both operational and strategic risks in order to achieve the strategic objectives articulated in this 2011/2012 Report on Plans and Priorities. Each cycle of the long-term planning process begins by considering proposals that deal with areas of high risk to programs and operations.
The agency has a long history of strong project management at the program level. Through the implementation of a Departmental Project Management Office, these practices will be strengthened organization-wide. Governance structures for decision-making will begin at the project steering committee level and escalate as required to the corporate level. This will enhance accountability, as required by the Policy on the Management of Projects.
In line with the Government’s commitment to demonstrate results for taxpayers’ dollars spent, Statistics Canada is continuing to improve the agency’s performance measurement framework. Statistics Canada’s program evaluation process requires programs to self-evaluate against a set of expected performance measurements. Refinements will be made to this process to align it with the requirements of the Policy on Evaluation that comes into effect in April 2013.
Specifically
2011/2012
- Update the corporate risk register and risk profile.
- Continue to integrate risk management in the corporate planning process.
- Continue improving the performance measurement framework.
- Pilot the Departmental Project Management Framework across the agency.
- Refine the agency evaluation process.
2012/2013
- Implement the refined evaluation process.
- Fully implement the Departmental Project Management Framework.
Planned activity: Develop and fund a multi-year capital plan to ensure the efficiency, continuity and quality of all statistical and support programs
Statistics Canada is developing its first Departmental Investment Plan, as required by the Policy on Investment Planning. This plan will document the strategic investments that will be made over a five-year planning horizon to address risks and to maintain the quality of statistical information, the agency’s assets and acquired services.
Specifically
2011/2012
- Deliver to Treasury Board Secretariat a five-year integrated Departmental Investment Plan of all assets, acquired services and projects.
- Complete Organizational Project Management Capacity Assessment and Project Complexity Risk Assessments, including supporting evidence for all projects included in the investment plan.
- Document a 10-year outlook of planned investments across the agency that will be integrated into the strategic planning process.
Planned activity: Align human resources capacity with the new long-term investment strategy
Statistics Canada’s Integrated Business and Human Resources Plan for 2010 to 2013 identifies the evolving needs of the new business priorities, including the 2011 Census, the new National Household Survey, and the Consumer Price Index enhancement initiative. In introducing the new Departmental Investment Plan, Statistics Canada will realign its integrated planning activities to take into consideration the longer-term horizon.
Specifically
2011/2012
- Align the agency’s human resource goals and objectives with the priorities of the government of Canada, Public Service Renewal objectives and the new Departmental Investment Plan.
- Complete recruitment of 27,000 employees to deliver on the 2011 Census of Population, the Census of Agriculture and the new National Household Survey—2,300 under the Statistics Canada Census and Survey Related Term Employment Exclusion Approval Order, and 24,700 under the Statistics Act.
- Revise recruitment and development programs to build and support the agency’s workforce.
- Implement the revised training programs for new executives.
- Implement year two of the five-year employment equity plan in the areas of recruitment, learning and language training to promote a diverse workforce.
- Implement a more tailored collective staffing model designed to meet business needs.
Planned activity: Strengthen the corporate statistical IM framework
Information is Statistics Canada’s business. Information management (IM) is integral to the strategic outcome of the national statistical office—to provide Canadians with access to a trusted source of information.
A new IM policy and IM strategy respond to Statistics Canada’s business needs, as described in the Corporate Business Plan. The IM action plan outlines how the IM strategy will be implemented from 2010/2011 to 2012/2013.
The objective of the IM action plan is to address the highest priority information management challenges that the agency faces as it pursues the corporate objectives of relevance, access, quality, and efficiency. Initiatives are aligned with the priority components of the Enterprise Government of Canada IM Framework http://www.tbs-sct.gc.ca/im-gi/ims-sgi/ims-sgi-eng.asp.
Specifically
2011/2012
- Implement data service centres for statistical microdata.
- Delivery of training and awareness programs on IM policy and strategy.
2012/2013
- Implement data service centres for statistical aggregate data.
- Develop and implement plan for review of the Document Management Centre.
2013/2014
- Continue implementing data service centres for statistical data.
- Implement approved recommendations from the review of the Document Management Centre.
Planned activity: Consolidate the procurement, management and evergreening of the agency’s desktop equipment
Statistics Canada’s evergreening strategy for most of its IT infrastructure components is based on a seven-year capital plan. At present, all IT components are managed through this capital plan except for the PCs, laptops, monitors, and printers that are managed at the program level.
In 2011/2012, Statistics Canada will introduce a centralized service to procure PCs, laptops, monitors, and printers for the whole agency. This service will manage this equipment’s life cycle, including regularly replacing it. The objective is to make better use of the agency’s existing bulk-buying approach, reduce equipment diversity, ensure that appropriate funding and evergreening practices are in place, and implement a more predictable long-term investment strategy. All this should reduce risks and costs, and improve efficiency. This new initiative will be completed by the end of 2011/2012.
Specifically
2011/2012
- Determine the appropriate replacement cycle for each type of equipment.
- Develop a financial strategy that ensures the long-term viability of the centralized service.
- Develop a procurement plan for each equipment type that minimizes costs to the agency while ensuring that user needs are met with respect to equipment performance.
- Implement the procurement plan and ensure timely delivery.
- Implement the processes needed to sustain the service over time.
Planned activity: Launch a comprehensive review of the dissemination model
To better meet the evolving needs of data users, Statistics Canada will review its dissemination model in 2011/2012. A complete review of products and services will be carried out, including an evaluation of how they are distributed on the website. The agency will consider increasing the availability of free data and removing barriers to redistribution. This would offer greater access to data, generating both social benefit and economic activity.
Specifically
2011/2012
- Implement social media and online tools to stay connected with users and better understand their requirements and expectations.
- Undertake significant user consultations to better understand how the current dissemination model meets user needs, and identify priorities for improvement.
2012/2013
- Develop a new dissemination model, including proof of concept.
- Launch a project to integrate user interfaces to provide a single, consistent approach for users to access the output databases.
- Review and update the strategic vision and priorities for the website.
2013/2014
- Test and integrate the new dissemination model, which will be launched in 2014/2015.
- Continue integrating user interfaces and improving information delivery channels.
Section 3 — Supplementary information
The future-oriented financial highlights presented within this RPP are intended to serve as a general overview of Statistics Canada’s forecast financial position and operations. Future-oriented financial statements can be found at http://www.statcan.gc.ca/rpp/2011-2012/financ-eng.htm.
Financial highlights
| Future-oriented Condensed Statement of Operations For the year ended March 31 |
|||
|---|---|---|---|
| Change | Future-oriented 2011/2012 |
Future-oriented 2010/2011 |
|
| % | $ thousands | ||
| Expenses | |||
| Total Expenses | 29.7 | 954,882 | 736,478 |
| Revenues | |||
| Total Revenues | 18.0 | 115,044 | 97,515 |
| Net Cost of Operations | 31.4 | 839,838 | 638,963 |
| Future-oriented Condensed Statement of Financial Position For the year ended March 31 |
|||
|---|---|---|---|
| Change | Future-oriented 2011/2012 |
Future-oriented 2010/2011 |
|
| % | $ thousands | ||
| Assets | |||
| Total Assets | -0.9 | 217,579 | 219,585 |
| Liabilities | |||
| Total Liabilities | -1.6 | 162,739 | 165,424 |
| Equity | 1.3 | 54,840 | 54,161 |
| Total | -0.9 | 217,579 | 219,585 |
Notes
The departmental financial statements and associated highlights have been prepared on an accrual accounting basis, and therefore differ from the figures presented in previous sections, which are based on authorities voted by Parliament on a modified cash basis. Note 3 of the financial statements provides a reconciliation of accrual-to-cash accounting methods.
Totals may differ between tables because of rounding.
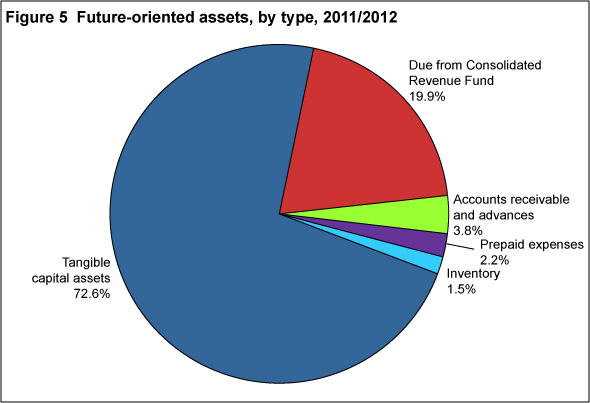
Total assets are anticipated to be $217.6 million in 2011/2012, down $2.0 million from the 2010/2011 projection. Of this amount, tangible capital assets are projected to total $157.9 million, up approximately $1.1 million, or 0.7%, from the 2010/2011 projection. Tangible capital assets make up the largest portion of assets, 72.6% of the total. They mainly comprise software under development, $60.6 million; computer software, $53.5 million; computer hardware, $29.1 million; and leasehold improvements, $14.0 million. Of the remaining assets, accounts receivable and advances are expected to be $8.3 million; prepaid expenses, $4.9 million; and inventory, $3.2 million.
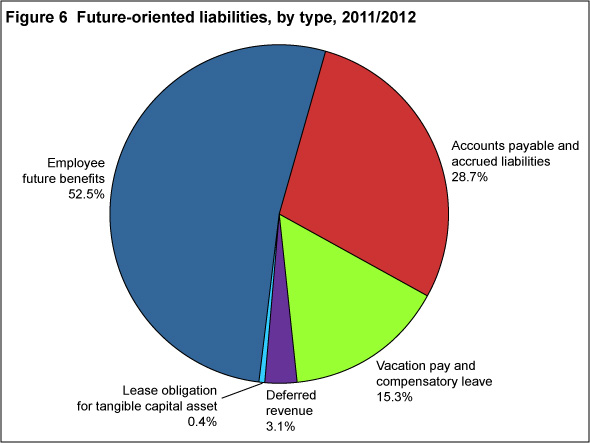
Total liabilities are anticipated to be $162.7 million for 2011/2012, a net decrease of $2.7 million from 2010/2011 projections. Employee future benefits make up the largest portion of the liabilities, $85.4 million, or 52.5% of total liabilities. Accounts payable and accrued liabilities make up the next largest portion, $46.7 million, or 28.7% of total liabilities. It comprises accounts payable to external parties, $26.8 million; accounts payable to other federal government departments and agencies, $10.9 million; and accrued salaries and wages, $9.0 million. Vacation pay and compensatory leave make up $24.9 million, or 15.3% of the total.
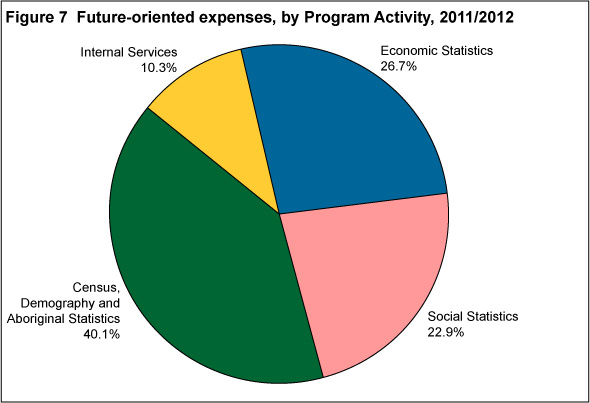
Statistics Canada projects $954.9 million in expenditures for 2011/2012, an increase of $218.4 million from 2010/2011 projections. The main reason is that 2011/2012 is the peak year for the 2011 Census of Population, the NHS, and the 2011 Census of Agriculture. Forecast expenditures for 2011/2012 are broken down by Program Activity as follows: Census, Demography and Aboriginal Statistics accounts for $382.9 million, or 40.1%; Economic Statistics, $255.0 million, or 26.7%; Social Statistics, $218.7 million, or 22.9%; and Internal Services, $98.3 million, or 10.3%.
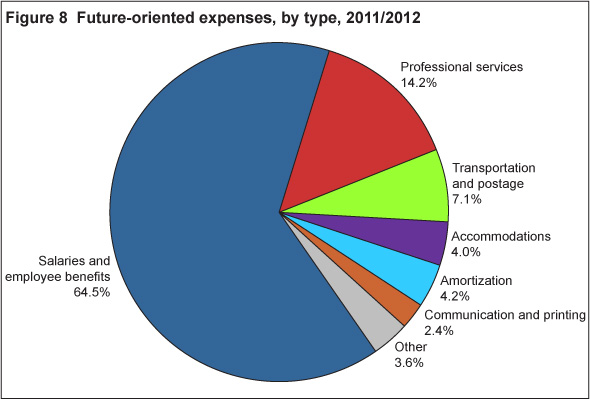
Statistics Canada projects $954.9 million in expenses for 2011/2012. The expenses are broken down as follows: salaries and employee benefits, $615.4 million; professional services, $135.7 million; transportation and postage, $67.4 million; amortization, $39.7 million; accommodations, $38.4 million; communication and printing, $22.9 million; and other expenses, $35.4 million.
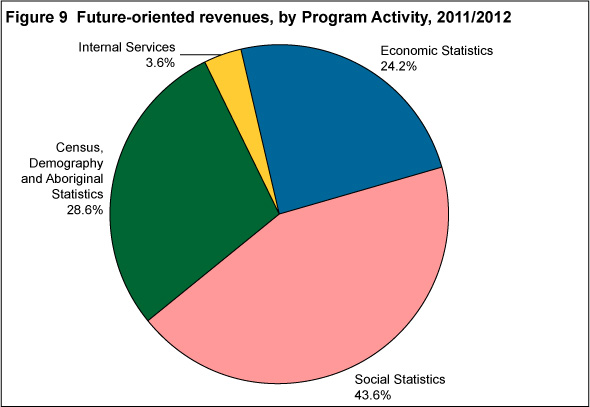
Statistics Canada's projected total revenues in 2011/2012 are $115.0 million, an increase of $17.5 million over the 2010/2011 forecast. Revenues generated by Program Activity are projected as follows: Social Statistics, $50.2 million, or 43.6%; Census, Demography and Aboriginal Statistics, $32.9 million, or 28.6%; Economic Statistics, $27.8 million, or 24.2%; and Internal Services, $4.1 million, or 3.6%.
Supplementary information tables
All electronic supplementary information tables found in the 2011/2012 Report on Plans and Priorities can be found on the Treasury Board of Canada Secretariat’s website at http://www.tbs-sct.gc.ca/rpp/st-ts-eng.asp.
These tables cover
- green procurement
- internal audits
- evaluations
- sources of respendable and non-respendable revenue
- summary of capital spending by program activity.
Section 4 — Other items of interest
Corporate business plan
For information about Statistics Canada’s corporate business plan, please see
http://www.statcan.gc.ca/about-apercu/reports2-rapports2-eng.htm