
Treasury Board of Canada Secretariat
www.tbs-sct.gc.ca
Common menu bar links
Breadcrumb Trail
ARCHIVED - Canada Border Services Agency
 This page has been archived.
Archived Content
Information identified as archived on the Web is for reference, research or recordkeeping purposes. It has not been altered or updated after the date of archiving. Web pages that are archived on the Web are not subject to the Government of Canada Web Standards. As per the Communications Policy of the Government of Canada, you can request alternate formats on the "Contact Us" page.
SECTION III: SUPPLEMENTARY INFORMATION
Organizational Information
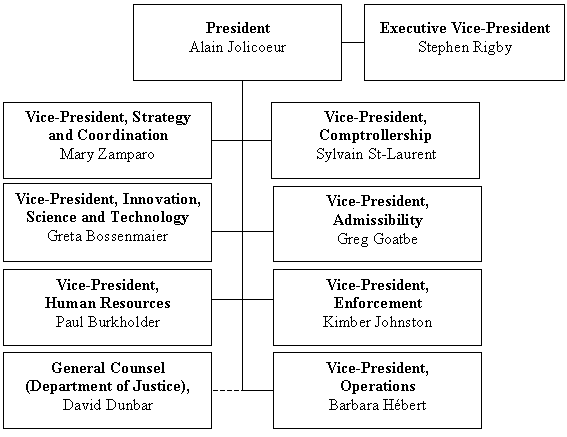
The CBSA is organized into seven branches and each one is headed by a Vice-President who reports directly to the President. The Executive Vice-President provides support to the President and concentrates on the leadership of the Agency’s program and operational management, as well as the management of financial resources and comptrollership.
Operations are delivered in eight regions: Atlantic, Quebec, Northern Ontario, Greater Toronto Area, Windsor–St. Clair, Niagara–Fort Erie, Prairies and Pacific. CBSA officers are also located at 39 points abroad. The Admissibility and Enforcement branches develop the programs and policies that the Operations Branch delivers. The Innovation, Science and Technology Branch works with these branches to ensure that we maximize our capacity to support effective and efficient operations. Underpinning all our policy, program and operational work are the critical strategic and enabling functions that span the Strategy and Coordination, Human Resources and Comptrollership branches. The CBSA also works closely with its Department of Justice Legal Services Unit to ensure that CBSA operations, service delivery, policy development, corporate direction and management are legally supportable.
This structure encourages strong internal synergies among all program areas and supports clear accountability for all functions. Everything we do is focused on maximizing and supporting the performance of our front line.Table 1: Comparison of Planned to Actual Spending (including FTEs)
|
(thousands of dollars) |
|
|
2006–2007 |
|||
|---|---|---|---|---|---|---|
|
Main |
Planned |
Total |
Actual |
|||
| Program Activity[17] | ||||||
|
Security |
256,576 |
300,599 |
447,250 |
557,500 |
422,610 |
358,366 |
|
Access |
719,640 |
682,349 |
764,356 |
780,381 |
759,674 |
719,283 |
|
Science- and Technology-based Innovation |
100,338 |
200,841 |
94,037 |
141,259 |
292,752 |
223,959 |
|
Less: |
(15,464) |
(14,938) |
(12,110) |
(12,110) |
(20,508) |
(20,508) |
|
Total |
1,061,090 |
1,168,851 |
1,293,533 |
1,467,030 |
1,454,528 |
1,281,100 |
|
Less: Non‑respendable revenue |
(31,231) |
(44,382) |
|
(38,563) |
|
(55,044) |
|
Plus: Cost of services received without charge |
103,853 |
111,685 |
|
109,527 |
119,300 |
119,300 |
|
Total Departmental Spending |
1,133,712 |
1,236,154 |
|
1,537,994 |
1,573,828 |
1,345,356 |
| Full-time Equivalents(FTEs) |
10,758
|
12,077
|
|
12,763
|
|
12,383
|
Table 2: Resources by Program Activity
|
2006–2007 |
|||||
|
Program Activity |
Budgetary (thousands of dollars) |
||||
|---|---|---|---|---|---|
|
Operating |
Capital |
Total: Gross Budgetary Expenditures |
Less: |
Actual |
|
|
Security |
|
|
|
|
|
|
Main Estimates |
436,843 |
10,407 |
447,250 |
0 |
447,250 |
|
Planned Spending |
544,333 |
13,167 |
557,500 |
0 |
557,500 |
|
Total Authorities |
408,182 |
14,428 |
422,610 |
0 |
422,610 |
|
Actual Spending |
348,871 |
9,495 |
358,366 |
0 |
358,366 |
|
Access |
|
|
|
|
|
|
Main Estimates |
745,910 |
18,446 |
764,356 |
(12,110) |
752,246 |
|
Planned Spending |
761,935 |
18,446 |
780,381 |
(12,110) |
768,271 |
|
Total Authorities |
724,528 |
35,146 |
759,674 |
(20,508) |
739,166 |
|
Actual Spending |
700,714 |
18,569 |
719,283 |
(20,508) |
698,775 |
|
Science- and Technology-based Innovation |
|
|
|
|
|
|
Main Estimates |
94,037 |
0 |
94,037 |
0 |
94,037 |
|
Planned Spending |
141,259 |
0 |
141,259 |
0 |
141,259 |
|
Total Authorities |
290,652 |
2,100 |
292,752 |
0 |
292,752 |
|
Actual Spending |
221,879 |
2,080 |
223,959 |
0 |
223,959 |
|
Total |
|
|
|
|
|
|
Main Estimates |
1,276,790 |
28,853 |
1,305,643 |
(12,110) |
1,293,533 |
|
Planned Spending |
1,447,527 |
31,613 |
1,479,140 |
(12,110) |
1,467,030 |
|
Total Authorities |
1,423,362 |
51,674 |
1,475,036 |
(20,508) |
1,454,528 |
|
Actual Spending |
1,271,464 |
30,144 |
1,301,608 |
(20,508) |
1,281,100 |
Table 3: Voted and Statutory Items
|
Vote or |
Truncated Vote |
2006–2007 (thousands of dollars) |
|||
|---|---|---|---|---|---|
|
Main |
Planned |
Total |
Actual |
||
|
10 |
Operating expenditures |
1,119,660 |
1,284,058 |
1,264,927 |
1,113,152 |
|
15 |
Capital expenditures |
28,853 |
31,613 |
51,674 |
30,144 |
|
(S) |
Contributions to employee benefit plans |
145,020 |
151,359 |
136,845 |
136,845 |
|
(S) |
Spending of proceeds from the disposal of surplus Crown assets |
|
|
364 |
241 |
|
(S) |
Refunds of amounts credited to revenues in previous years |
|
|
718 |
718 |
|
|
Total |
1,293,533 |
1,467,030 |
1,454,528 |
1,281,100 |
Explanation of differences:
The $173 million difference between total authorities and actual is mainly the result of the following:
- $152 million as a net operating lapse mainly related to the following initiatives:
- Security and Prosperity Partnership of North America ($40 million);
- Securing Canada’s air cargo transportation system ($3 million);
- Arming CBSA officers and addressing work-alone situations ($23 million);
- Delays in the implementation of the Primary Automated Lookout System ($23 million);
- Container Security Initiative and Harmonized Risk Scoring — Advance Trade Data ($10 million); and
- Detection technology equipment ($17 million).
- $21 million lapse in capital expenditures:
- Delays in the construction of capital projects in Douglas, B.C., and in Stanstead and Rigaud in Quebec; and
- Radiation detection and other equipment related to the Asia-Pacific Gateway and Corridor initiative.
Table 4: Services Received Without Charge
|
(thousands of dollars) |
2006–2007 Actual Spending |
|---|---|
|
Accommodation provided by Public Works and Government Services Canada. |
52,062 |
|
Contributions covering employer’s share of employer’s insurance premiums and expenditures paid by the Treasury Board of Canada Secretariat (TBS) (excluding revolving funds). Employer’s contribution to employees’ insured benefits plans and associated expenditures paid by the TBS. |
62,388 |
|
Workers’ compensation coverage provided by Human Resources and Social Development Canada. |
452 |
|
Salary and associated expenditures of legal services provided by the Department of Justice. |
4,398 |
|
Total: 2006–2007 services received without charge |
119,300 |
Table 5: Sources of Respendable and Non-Respendable Revenue
Respendable Revenue
|
(thousands of dollars) |
Actual |
Actual |
2006–2007
|
|||
|---|---|---|---|---|---|---|
|
Main |
Planned |
Total |
Actual |
|||
|
Access |
|
|
|
|
|
|
|
Sale of goods and services |
1,458 |
1,440 |
1,754 |
1,754 |
1,867 |
1,867 |
|
Services of a regulatory nature |
2,821 |
2,604 |
1,931 |
1,931 |
4,516 |
4,516 |
|
Services of a non-regulatory nature |
11,185 |
10,894 |
8,425 |
8,425 |
14,125 |
14,125 |
|
Total: Access |
15,464 |
14,938 |
12,110 |
12,110 |
20,508 |
20,508 |
|
|
|
|
|
|
|
|
|
Total: Respendable Revenue |
15,464 |
14,938 |
12,110 |
12,110 |
20,508 |
20,508 |
Explanation of differences:
The major items accounting for the $8 million increase between the planned revenue and actual are the following:
- Canadian Food Inspection Agency fees ($2 million);
- Fees for the collection of provincial sales tax ($2 million);
- Alternative reporting programs ($2 million); and
- Customs services ($1 million).
Non-Respendable Revenue
|
(thousands of dollars) |
Actual |
Actual |
2006–2007 |
|||
|---|---|---|---|---|---|---|
|
Main |
Planned |
Total |
Actual |
|||
|
Security |
||||||
|
Adjustments to previous year’s expenditures |
1,461 |
4,689 |
|
3,137 |
|
4,200 |
|
Sale of goods and services |
|
|
|
|
|
|
|
Services of a regulatory nature |
2,565 |
2,783 |
|
2,727 |
|
1,926 |
|
Services of a non-regulatory nature |
424 |
898 |
|
674 |
|
|
|
Total: Sale of goods and services |
2,989 |
3,681 |
|
3,402 |
|
1,926 |
|
Miscellaneous |
|
|
|
|
|
|
|
GST/HST, customs import duties, excise and the Air Travellers Security Charge |
2,646 |
3,251 |
|
3,007 |
|
2,824 |
|
Sundries |
|
|
|
|
|
|
|
Court fines |
1,486 |
1,717 |
|
1,634 |
|
1,037 |
|
Customs seizures |
|
10 |
|
5 |
|
4 |
|
Investigations seizures |
2,892 |
716 |
|
1,840 |
|
5,455 |
|
Port seizures |
7,107 |
8,054 |
|
7,732 |
|
10,268 |
|
Interest and penalties[18] |
209 |
16,282 |
|
15,868 |
|
26,785 |
|
Other |
11,551 |
5,230 |
|
1,101 |
|
1,859 |
|
Total: Miscellaneous |
25,891 |
35,260 |
|
31,187 |
|
48,232 |
|
Total: Security |
30,341 |
43,630 |
|
37,725 |
|
54,358 |
|
Access |
||||||
|
Sale of goods and services |
|
|
|
|
|
|
|
Public building and property rental |
380 |
363 |
|
379 |
|
296 |
|
Total: Access |
380 |
363 |
|
379 |
|
296 |
|
Science- and Technology-based Innovation |
||||||
|
Sale of goods and services – rights and privileges: |
|
|
|
|
|
|
|
IonScan royalties |
510 |
389 |
|
458 |
|
390 |
|
Total: Science- and Technology-based Innovation |
510 |
389 |
|
458 |
|
390 |
|
|
||||||
|
Total: Non-Respendable Revenue |
31,231 |
44,382 |
|
38,563 |
|
55,044 |
Table 6: User Fees Act
|
User Fee |
Fee Type |
Fee-setting |
Date Last |
2006–2007 |
Planning Years |
|||||||||
|---|---|---|---|---|---|---|---|---|---|---|---|---|---|---|
|
Forecast Revenue |
Actual Revenue |
Full Cost |
Performance |
Performance Results |
Fiscal Year |
Forecast Revenue |
Estimated Full Cost |
|||||||
|
Regulatory |
||||||||||||||
|
Broker's licence and examination fees |
Regulatory |
Customs Act |
1992 |
400 |
367 |
740 |
Results received 4-6 weeks from date of exam. |
Results were received within 9 weeks from date of exam. This is due to a change in how the exams are marked. Corrective action has been taken to ensure the performance standard is met. |
2007–2008 2008–2009 2009–2010 |
375 375 375 |
750 750 750 |
|||
|
Customs sufferance warehouse licence fees |
Regulatory |
Customs Act |
1996 |
600 |
559 |
1,510
|
Application processed in 60 business days. |
All applications that were fully completed according to the requirements of the regulations under the Customs Act were processed within 60 business days. |
2007–2008 2008–2009 2009–2010 |
600 600 600 |
1,550 1,550 1,550 |
|||
|
Bonded warehouse licence fees |
Regulatory |
Customs Tariff |
1996 |
600 |
481 |
1,535 |
Operator to receive notice of determination within four weeks after an audit or examination |
The operator receives notice of determination 100% of the time within four weeks after an audit or examination. |
2007–2008 2008–2009 2009–2010 |
500 500 500 |
1,600 1,600 1,600 |
|||
|
Storage charges – Queen’s and frontier warehouses |
Regulatory |
Customs Act |
1992 |
400 |
206 |
404 |
Goods to be handled with care and stored in a secure manner to safeguard against damage or loss. |
No successful claims for damage or loss. |
2007–2008 2008–2009 2009–2010 |
250 250 250 |
415 415 415 |
|||
|
Customs special services fees |
Regulatory |
Customs Act |
1986 |
700 |
403 |
1,186 |
The relevant regulation under the Customs Act is currently under review. Service standards are being developed as part of this review. |
|
2007–2008 2008–2009 2009–2010 |
400 400 400 |
1,200 1,200 1,200 |
|||
|
Canadian Food Inspection Agency fees notice |
Regulatory |
Canadian Food Inspection Agency Act |
1997 |
400 |
2,302 |
6,577 |
Inspection activities are to be provided in accordance with corresponding federal regulations. |
|
2007–2008 2008–2009 2009–2010 |
2,300 2,300 2,300 |
6,600 6,600 6,600
|
|||
|
NEXUS |
Regulatory |
Customs Act |
2002 |
1,000 |
1,168 |
4,573 |
4-6 weeks** |
93% processed within 4-6 weeks** |
2007–2008 2008–2009 2009–2010 |
3,900 3,900 3,900 |
4,600 4,600 4,600 |
|||
|
FAST program |
Regulatory |
Customs Act |
2002 |
1,000 |
840 |
3,324 (driver registration) |
4-6 weeks** |
4-6 weeks** |
2007–2008 2008–2009 2009–2010 |
700 700 700 |
3,350 3,350 3,350 |
|||
|
CANPASS programs |
Regulatory |
Customs Act |
June 22, 2006* |
900 |
1,467 |
3,460 |
4-6 weeks** |
90% processed within 4-6 weeks** |
2007–2008 2008–2009 2009–2010 |
500 500 500 |
3,500 3,500 3,500 |
|||
|
Sub-total: Regulatory |
6,000 |
7,855 |
19,132 |
|
2007–2008 2008–2009 2009–2010 |
9,725 9,725 9,725 |
19,390 19,390 19,390 |
|||||||
|
Other Products and Services |
||||||||||||||
|
Fees charged for the processing of access requests filed under the Access to Information Act. |
Other products and services |
Access to Information Act |
1992 |
5 |
6
|
1,805 |
Response provided within 30 days following receipt of request; the response time may be extended pursuant to section 9 of the Access to Information Act. Notice of extension to be sent within 30 days after receipt of request. The Access to Information Act provides more details. |
1,064 access requests were completed in the 2006–2007 fiscal year: 30.1% were completed on time, 69.9% were completed late. These results reflect, in large part, staffing shortages, which are being addressed in the 2007–2008 fiscal year. Significant resources are being invested in staffing, policy and training to improve overall compliance ratings. |
2007–2008 2008–2009 2009–2010 |
5 5 5 |
1,800 1,800 1,800 |
|||
|
Sub-total: Other products and services |
5 |
6 |
1,805 |
|
2007–2008 2008–2009 2009–2010 |
5 5 5 |
1,800 1,800 1,800 |
|||||||
|
TOTAL: USER FEES
|
6,005 |
7,861 |
20,937 |
|
2007–2008 2008–2009 2009–2010 |
9,730 9,730 9,730 |
21,190 21,190 21,190 |
|||||||
* Modifications did not change fee or scope of program, so User Fees Act provisions are not applicable.
** The performance results provided reflect the Canadian portion of the application process up to inviting applicants to attend an office to finalize their memberships. The CBSA will review the existing published performance standards for processing applications with its partner (U.S. Customs and Border Protection) and consult with stakeholders (including the public) to clarify the
processing standards and adjust time frames as required. Revised time frames will be made available to the public on the Internet and in program brochures and guides.
Table 7: Summary Listing of Project Spending
For the 2006–2007 fiscal year, the following projects exceeded the CBSA’s delegated project approval level:[19]
- Clarenceville, Que.
- Andover, N.B.
- Cascade, B.C.
- Douglas, B.C.
- Emerson West, Man.
- Lacolle, Que.
- Stanstead Route 55 (Rock Island), Que.
- St. Stephen, N.B.
- Rigaud, Que.
- Fraser, B.C.
- Aldergrove, B.C.
- Regional realignment
- Enhancing road and rail cargo security — eManifest
- Canada–U.S. Harmonized Risk Scoring — Advance Trade Data
Supplementary information on project spending can be found on the Treasury Board of Canada Secretariat’s (TBS) Web site at www.tbs-sct.gc.ca/rpp/0607/info/ps-dp_e.asp.
Table 8: Status Report on Major Crown Projects
For the 2006–2007 fiscal year, the following project was deemed a Major Crown Project. Generally, projects are designated as Major Crown Projects when their estimated cost will exceed $100 million and the project risk is assessed as high.
- eManifest
Table 9: Financial Statements
Statement of Management Responsibility
Responsibility for the integrity and objectivity of the accompanying financial statements for the year ending March 31, 2007 and all information contained in these statements rests with Canada Border Services Agency’s (Agency) management. These financial statements have been prepared by management in accordance with accounting policies issued by the Treasury Board of Canada Secretariat which are consistent with Canadian generally accepted accounting principles for the public sector. The financial statements of the Agency have not been audited.
Some of the information in the financial statements is based on management’s best estimates and judgment and gives due consideration to materiality. To fulfill its accounting and reporting responsibilities, management maintains a set of accounts that provides a centralized record of the Agency’s financial transactions. Financial information submitted to the Public Accounts of Canada and included in the Agency’s Departmental Performance Report is consistent with these financial statements.
Management maintains a system of financial management and internal control designed to provide reasonable assurance that financial information is reliable, that assets are safeguarded and that transactions are in accordance with the Financial Administration Act, are executed in accordance with prescribed regulations, within Parliamentary authorities, and are properly recorded to maintain accountability of government funds. Management also seeks to ensure the objectivity and integrity of data in its financial statements by careful selection, training and development of qualified staff, by organizational arrangements that provide appropriate divisions of responsibility, and by communication programs aimed at ensuring that regulations, policies, standards and managerial authorities are understood throughout the Agency.
Alain Jolicoeur, President
Ottawa, Canada
August 16, 2007
Sylvain St-Laurent, Senior Financial Officer
Ottawa, Canada
August 14, 2007
Canada Border Services Agency
Statement of Operations (Unaudited)
For the Year Ended March 31
(in thousands of dollars)
| 2007 | 2006 (restated) | ||||||
|---|---|---|---|---|---|---|---|
|
|
Access |
Security |
Science |
Total |
Total |
||
|
Revenues |
|||||||
|
Tax revenues |
|
|
|
|
|
||
|
Excise taxes (Note 4) |
21,370,613 |
- |
- |
21,370,613 |
23,345,397 |
||
|
Customs import duties |
3,704,222 |
- |
- |
3,704,222 |
3,329,810 |
||
|
Excise duties (Note 5) |
895,237 |
- |
- |
895,237 |
79,580 |
||
|
|
25,970,072 |
- |
- |
25,970,072 |
26,754,787 |
||
|
Non-tax revenues |
|
|
|
|
|
||
|
Sale of goods and services |
19,782 |
2,709 |
329 |
22,820 |
20,262 |
||
|
Interest, penalties & fines |
27,887 |
33 |
8 |
27,928 |
17,999 |
||
|
Seized property |
15,727 |
- |
- |
15,727 |
8,780 |
||
|
Forfeitures of cash bonds |
- |
2,057 |
- |
2,057 |
2,384 |
||
|
Gain on sale of assets |
132 |
67 |
15 |
214 |
2,409 |
||
|
Miscellaneous |
1,319 |
558 |
(49) |
1,828 |
4,995 |
||
|
|
64,847 |
5,424 |
303 |
70,574 |
56,829 |
||
|
|
|
|
|
|
|
||
|
Total Revenues |
26,034,919 |
5,424 |
303 |
26,040,646 |
26,811,616 |
||
|
|
|
|
|
|
|
||
|
Operating Expenses |
|||||||
|
Salaries and employee benefits |
672,997 |
282,439 |
88,686 |
1,044,122 |
984,635 |
||
|
Professional and special services |
34,233 |
48,690 |
114,967 |
197,890 |
154,588 |
||
|
Transportation and telecommunication |
21,813 |
27,695 |
5,220 |
54,728 |
48,130 |
||
|
Rental of land and buildings |
32,341 |
16,647 |
3,623 |
52,611 |
49,634 |
||
|
Bad debts (Recovery) |
50,996 |
- |
- |
50,996 |
(636) |
||
|
Amortization |
7,901 |
6,629 |
13,901 |
28,431 |
27,634 |
||
|
Repair and maintenance |
17,728 |
7,793 |
2,427 |
27,948 |
19,325 |
||
|
Materials and supplies |
11,158 |
6,041 |
1,818 |
19,017 |
15,936 |
||
|
Consumable machinery and equipment (parts) |
12,231 |
7,869 |
(2,028) |
18,072 |
20,670 |
||
|
Other |
2,242 |
2,923 |
481 |
5,646 |
8,610 |
||
|
|
|
|
|
|
|
||
|
Total Expenses |
863,640 |
406,726 |
229,095 |
1,499,461 |
1,328,526 |
||
|
|
|
|
|
|
|
||
|
Net Results |
25,171,279 |
(401,302) |
(228,792) |
24,541,185 |
25,483,090 |
||
Canada Border Services Agency
Statement of Financial Position (Unaudited)
At March 31
(in thousands of dollars
|
2007 |
2006 |
|
|---|---|---|
| ASSETS | ||
|
Financial assets |
|
|
|
Cash |
2,066,739 |
2,071,048 |
|
Accounts receivable and advances (Note 6) |
17,444 |
8,080 |
|
Tax receivables (Note 7) |
1,295,042 |
1,171,459 |
|
Total financial assets |
3,379,225 |
3,250,587 |
|
|
|
|
|
|
|
|
|
Non-financial assets |
|
|
|
|
|
|
|
Prepaid expenses |
159 |
0 |
|
Inventory |
3,806 |
4,358 |
|
Tangible capital assets (Note 8) |
312,329 |
292,432 |
|
Total non-financial assets |
316,294 |
296,790 |
|
|
|
|
|
TOTAL |
3,695,519 |
3,547,377 |
|
|
|
|
| LIABILITIES AND EQUITY OF CANADA | ||
|
|
|
|
|
Liabilities |
|
|
|
Accrued accounts payable and accrued liabilities (Note 9) |
94,036 |
87,937 |
|
Payable to provinces (Note 10) |
8,242 |
7,569 |
|
Tax payables |
23,666 |
24,136 |
|
Deposit accounts (Note 11) |
40,823 |
39,670 |
|
Salary, vacation pay and compensatory leave |
82,147 |
71,967 |
|
Employee severance benefits (Note 12) |
168,061 |
118,288 |
|
|
416,975 |
349,567 |
|
|
|
|
|
Equity of Canada |
3,278,544 |
3,197,810 |
|
|
|
|
|
TOTAL |
3,695,519 |
3,547,377 |
Contingent liabilities (Note 13)
Contractual obligations (Note 14)
The accompanying notes form an integral part of these financial statements.
Canada Border Services Agency
Statement of Equity of Canada (Unaudited)
For the Year Ended March 31
(in thousands of dollars)
|
|
2007 |
2006 |
|---|---|---|
|
|
|
|
|
Equity of Canada, beginning of year |
3,197,810 |
2,987,286 |
|
|
|
|
|
Net results |
24,541,185 |
25,483,090 |
|
|
|
|
|
Current year appropriations used (Note 3) |
1,281,100 |
1,168,851 |
|
|
|
|
|
Revenue not available for spending |
(26,041,424) |
(26,797,314) |
|
|
|
|
|
Change in net position in the Consolidated Revenue Fund (Note 3c) |
180,573 |
244,212 |
|
|
|
|
|
Services provided without charge from other government |
119,300 |
111,685 |
|
|
|
|
|
Equity of Canada, end of year |
3,278,544 |
3,197,810 |
The accompanying notes form an integral part of these financial statements.
Canada Border Services Agency
Statement of Cash Flow (Unaudited)
For the Year Ended March 31
(in thousands of dollars)
| 2007 | 2006 | |
|---|---|---|
| Operating activities | ||
| Net results |
24,541,185
|
25,483,090
|
|
|
|
|
| Non-cash items: |
|
|
| Services provided without charge by other government departments |
119,300
|
111,685
|
| Amortization of tangible capital assets |
28,431
|
27,634
|
| Adjustment to Capital Assets |
(8,866)
|
10
|
| Legal Services (Justice) expense |
435
|
-
|
| Bad debt expense |
158
|
-
|
| Contaminated Liability expense |
(59)
|
-
|
|
|
|
|
| Variations in Statement of Financial Position: |
|
|
| Increase (Decrease) in accounts receivable and advances |
(9,364)
|
7,116
|
| Increase in tax receivables |
(123,583)
|
(223,953)
|
| Increase (Decrease) in prepaid expenses |
(159)
|
166
|
| Decrease in inventory |
552
|
483
|
| Increase (Decrease) in accounts payable and accrued liabilities |
6,099
|
(17,253)
|
| Increase in payable to provinces |
673
|
1,593
|
| Increase in deposit accounts |
1,153
|
1,688
|
| Decrease (Increase) in vacation pay and compensatory leave |
10,180
|
(10,654)
|
| Decrease (Increase) in tax payables |
(470)
|
774
|
| Increase in employee severance benefits |
49,773
|
30,926
|
|
|
|
|
| Cash generated by operating activities |
24,615,438
|
25,413,305
|
|
|
|
|
| Capital investment activities | ||
| Acquisitions of tangible capital assets |
(40,210)
|
(36,506)
|
| Proceeds from disposal of tangible capital assets |
214
|
2,077
|
| Cash used by capital investment activities |
(39,996)
|
(34,429)
|
|
|
|
|
| Financing activities | ||
| Net cash forwarded to the Government of Canada |
(24,579,751)
|
(25,384,251)
|
| Net cash used |
(4,309)
|
(5,375)
|
|
|
|
|
| Cash, beginning of year |
2,071,048
|
2,076,423
|
| Cash, end of year |
2,066,739
|
2,071,048
|
The accompanying notes form an integral part of these financial statements.
1. Authority and Purpose
The Canada Border Services Agency (the “Agency”) was established effective December 12, 2003, when the Government announced a restructuring that resulted in the creation of the Agency, through the transfer of portions of the Canada Revenue Agency (CRA), Citizenship and Immigration Canada (CIC) and the Canadian Food Inspection Agency (CFIA).
The Agency is responsible for providing integrated border services that support national security and public safety priorities and facilitate the free flow of persons and goods. The act to establish the Canada Border Services Agency received royal assent November 3, 2005. The Agency is a departmental corporation named in Schedule II of the Financial Administration Act and reports to Parliament through the Minister of Public Safety. The Agency is funded through appropriations from the Government of Canada.
The Agency is responsible for the administration and enforcement of the following acts or portions of these acts: the Customs Act, the Customs Tariff, the Excise Act, the Excise Tax Act, the Citizenship Act, the Immigration and Refugee Protection Act, as well as other acts on behalf of other Federal departments and provinces.
In delivering its mandate, the Agency operates under the following program activities:
- The Access program activity contributes to the security and prosperity of Canada through the development of national programs and operational policies related to admissibility, processing and recourse mechanisms for the import and export of goods and the movement of people, and investigating complaints related to unfair trade practices.
- The Security program activity ensures enforcement of Canadian legislation related to border management, by providing sound intelligence to decision makers, and by acting as a focal point for Agency relations with partners in the security, intelligence, and law enforcement communities.
- The Science and Technology Based Innovation program activity enables and supports efficient and effective border management, and plays an important role in protecting Canadians from existing risk and emerging threats, through the development, implementation, delivery, and maintenance of innovative and cost effective technology and science solutions.
2. Summary of Significant Accounting Policies
The financial statements have been prepared in accordance with Treasury Board accounting policies which are consistent with Canadian generally accepted accounting principles for the public sector.
Significant accounting policies are as follows:
(a) Parliamentary appropriations
The Agency is financed by the Government of Canada through Parliamentary appropriations. Appropriations provided to the department do not parallel financial reporting according to generally accepted accounting principles since appropriations are primarily based on cash flow requirements. Consequently, items recognized in the statement of operations and the statement of financial position are not necessarily the same as those provided through appropriations from Parliament. Note 3 provide a high-level reconciliation between the bases of reporting.
(b) Net Cash Forwarded to the Government of Canada
The Agency operates within the Consolidated Revenue Fund (CRF), which is administered by the Receiver General for Canada. All cash received by the Agency is deposited to the CRF and all cash disbursements made by the Agency are paid from the CRF. The net cash forwarded to the Government of Canada is the difference between all cash receipts and all cash disbursements including transactions between departments of the federal government.
(c) Change in net position in the Consolidated Revenue Fund
The change in net position in the Consolidated Revenue Fund is the difference between the net cash provided by Government and appropriations used in a year, excluding the amount of non re-spendable revenue recorded by the department. It results from timing differences between when a transaction affects appropriations and when it is processed through the CRF.
(d) Tax revenues
Tax revenues reported in this statement include revenues collected under the authority of the Customs Act, the Customs Tariff, the Excise Act and the Excise Tax Act. These taxes include excise taxes, which consist of Goods and Services and Harmonized Sales taxes (GST/HST), excise duties and customs import duties. Domestic harmonized and goods and services taxes, as well as the input tax credits accorded for GST/HST paid on importations and domestic transactions, are not reflected in these statements as the Canada Revenue Agency is responsible for their administration.
The determination of the Agency’s tax revenues is based on the taxes and duties assessed that relate to goods authorized by the Agency to enter into Canada during the fiscal year ended March 31 and prior years. These revenues are recognized at the time the goods are released.
(i) Assessment definition
An assessment (or reassessment) of taxes is defined as all decisions and other steps made or taken by the Minister of Public Safety and officials of the Agency under the federal, provincial, and territorial acts or sections of the acts administered by the Agency to determine taxes payable by importers. When verifying an importer’s declaration, the Agency uses the applicable provisions of the various acts it administers as well as other internally developed criteria which are designed to substantially meet the provisions of these acts.
(ii) Completeness of tax revenues
The Canadian customs and tax systems are predicated on self-assessment where importers are expected to understand the laws and comply with them. This has an impact on the completeness of duty and tax revenues when importers fail to comply with laws, for example, if they do not declare or incorrectly declare goods imported. The Agency has implemented systems and controls in order to detect and correct situations where importers are not complying with the various acts it administers. These systems and controls include performing audits of importer records where determined necessary by the Agency. Such procedures cannot be expected to identify all undeclared or incorrectly declared importations or other cases of non-compliance. The Agency does not estimate the amount of unreported duties and taxes. However, such amounts are included in revenues when assessed.
(e) Non-tax revenues
Non-tax revenues reported in this statement include revenues collected on behalf of the Government of Canada under the Immigration and Refugee Protection Act, the Agriculture and Agri-Food Administrative Monetary Penalties Act and other similar legislation.
Non-tax revenues are accounted for in the period in which the underlying transaction or event occurred that gave rise to the revenues.
(f) Expenses
All expenses are recorded on an accrual basis:
- Vacation pay and compensatory leave are expensed as the benefits accrue to employees under their respective terms of employment. The liability for vacation pay and compensatory leave is calculated at the salary levels in effect at the end of the year for all unused vacation pay and compensatory leave benefits accruing to employees.
- Services provided without charge by other government departments for accommodation, workers’ compensation benefits, the employer’s contribution to the health and dental insurance plans and legal services are recorded as operating expenses at their estimated cost.
(g) Cash
Cash includes amounts received in Agency offices or by Agency agents as at March 31 but not yet deposited to the credit of the Consolidated Revenue Fund of the Government of Canada.
(h) Accounts receivable and advances
Accounts receivable and advances are stated at amounts expected to be ultimately realized; a provision is made for doubtful accounts where recovery is considered uncertain.
(i) Tax receivables
Tax receivables represent duties and taxes and other revenues assessed or estimated by the Agency but not yet collected. A significant portion of the receivable balance is due to the recording of accrued receivables, which relate to the current fiscal year but are not due for payment until the next fiscal year. All receivables are stated at amounts ultimately expected to be realized. A provision is made for doubtful accounts where recovery is considered uncertain. This allowance for doubtful accounts reflects management’s best estimate of the collectibility of amounts assessed but not yet paid.
(j) Inventory
Inventory consists of forms, publications and uniforms and is not intended for resale. They are valued at cost using the weighted average cost method. Items which are considered obsolete are written off. The cost of inventory is charged to operations in the period in which the items are used.
(k) Tangible capital assets
All tangible capital assets having an initial cost of $10,000 or more are recorded at their acquisition cost. Amortization of capital assets, except land, is performed on a straight-line basis over the estimated useful lives of the assets as follows:
| Asset Class | Amortization period |
|---|---|
| Buildings | 30 years |
| Works and infrastructure | 40 years |
| Machinery and equipment | 10 years |
| Information technology equipment | 5 years |
| In house developed software | 7 years |
| Purchased software | 3 years |
| Vehicles | 5 years |
Assets under construction are not amortized until completed and put into operation.
(l) Tax payables
Tax payables represent the excise taxes (GST and HST), excise duties and customs import duties due to importers as a result of assessments to the benefit of importers for current or prior year imports.
(m) Employee future benefits
(i) Pension benefits: Eligible employees participate in the Public Service Superannuation Plan, a multiemployer plan administered by the Government of Canada. The Agency’s contributions to the Plan are charged to expense in the year incurred and represent the Agency’s total obligation to the Plan. Current legislation does not require the Agency to make contributions for any actuarial deficiencies of the Plan.
(ii) Severance benefits: Employees are entitled to severance benefits under labour contracts or conditions of employment. These benefits are accrued as employees render the services necessary to earn them. The obligation relating to the benefits earned by employees is calculated using information derived from the results of the actuarially determined liability for employee severance benefits for the Government as a whole.
(n) Contingent liabilities
Contingent liabilities are potential liabilities, which may become actual liabilities when one or more future events occur or fail to occur. To the extent that the future event is likely to occur or fail to occur, and a reasonable estimate of the loss can be made, an estimated liability is accrued and an expense recorded. If the likelihood is not determinable or an amount cannot be reasonably estimated, the contingency is disclosed in the notes to the financial statements.
(o) Environmental liabilities
Environmental liabilities reflect the estimated costs related to the management and remediation of contaminated sites. Based on management’s best estimates, a liability is accrued and an expense recorded when the contamination occurs or when the Agency becomes aware of the contamination and is obligated, or is likely to be obligated to incur remedial costs. If the likelihood of the Agency’s obligation to incur these costs is either not determinable or unlikely, or if an amount cannot be reasonably estimated, the costs are disclosed as contingent liabilities in the notes to the financial statements.
(p) Measurement uncertainty
The preparation of these financial statements, in accordance with Treasury Board accounting policies which are consistent with Canadian generally accepted accounting principles for the public sector, requires management to make estimates and assumptions that affect the reported amounts of assets, liabilities, revenues and expenses reported in the financial statements. At the time of preparation of these statements, management believes the estimates and assumptions to be reasonable. The most significant items where estimates are used are contingent liabilities, environmental liabilities, the liability for employee severance benefits, the allowances for doubtful accounts (there are distinct methodologies between tax revenues and non-tax revenues) and the useful life of tangible capital assets. Actual results could significantly differ from those estimated. Management’s estimates are reviewed periodically and, as adjustments become necessary, they are recorded in the financial statements in the year they become known.
3. Parliamentary Appropriations
The Agency receives most of its funding through Parliamentary appropriations. Items recognized in the statement of operations and the statement of financial position in one year may be funded through Parliamentary appropriations in prior, current or future years. Accordingly, the Agency has different net results for the year on a government-funding basis than on an accrual accounting basis. These differences are reconciled below:
(a) Reconciliation of net results to current year appropriations used
| 2007 | 2006 | |
|---|---|---|
|
(in thousands of dollars)
|
||
| Net cost of operations |
(24,541,185)
|
(25,483,090)
|
|
|
|
|
| Adjustments for items affecting net results but not affecting appropriations |
||
|
|
|
|
| Add (Less) : |
|
|
| Revenue not available for spending |
26,041,424
|
26,797,314
|
| Services provided without charge |
(119,300)
|
(111,685)
|
| Amortization of tangible capital assets |
(28,431)
|
(27,634)
|
| Employee severance benefits |
(49,773)
|
(30,926)
|
| Other |
(61,845)
|
(9,523)
|
|
25,782,075
|
26,617,546
|
|
|
|
|
|
| Adjustments for items not affecting net results but affecting appropriations | ||
|
|
|
|
| Add (Less) : |
|
|
| Acquisition of tangible capital assets |
40,210
|
30,106
|
| Inventory purchased |
0
|
4,046
|
| Prepaid expenses |
0
|
243
|
|
|
|
|
| Current year appropriations used |
1,281,100
|
1,168,851
|
(b) Appropriations provided and used
| 2007 | 2006 | |
|---|---|---|
|
(in thousands of dollars)
|
||
| Parliamentary appropriations | ||
| Vote 10 – Operating expenditures |
1,264,927
|
1,043,931
|
| Vote 15 – Capital expenditures |
51,674
|
32,297
|
|
1,316,601
|
1,076,228
|
|
|
|
|
|
| Statutory amounts | ||
| Contributions to employee benefit plans |
136,844
|
136,082
|
| Spending proceeds from disposal of surplus crown assets |
365
|
240
|
| Refunds of amounts credited to revenues previous years |
718
|
15
|
|
137,927
|
136,337
|
|
|
|
|
|
| Lapsed appropriations | ||
| Vote 10 – Operating expenditures |
(151,775)
|
(29,443)
|
| Vote 15 – Capital expenditures |
(21,529)
|
(14,180)
|
|
(173,304)
|
(43,623)
|
|
|
|
|
|
| Appropriations available for future years |
(124)
|
(91)
|
|
|
|
|
|
|
|
|
| Current year appropriations used |
1,281,100
|
1,168,851
|
(c) Reconciliation of net cash provided by (forwarded to) Government to current year appropriations used
|
|
2007 |
2006 |
|---|---|---|
|
(in thousands of dollars)
|
||
|
|
|
|
|
Net cash provided by (deposited to) Government |
(24,579,751) |
(25,384,251) |
|
|
|
|
|
Revenue not available for spending |
26,041,424 |
26,797,314 |
|
|
|
|
|
Change in net position in the Consolidated Revenue Fund |
|
|
|
Variation in accounts receivable |
(132,947) |
(216,837) |
|
Variation in accounts payable and accrued liabilities |
7,455 |
(13,198) |
|
Other adjustments |
(55,081) |
(14,177) |
|
|
(180,573) |
(244,212) |
|
|
|
|
|
|
|
|
|
Current year appropriations used |
1,281,100 |
1,168,851 |
4. Excise Taxes
Effective July 1, 2006, the GST and HST rates, applied against imported goods, were reduced from 7% and 15% to 6% and 14% respectively. The excise tax revenue amount appearing in the Statement of Operations reflects the reduction in the rates. Revenues from excise of $21,370,613 thousands (23,345,397 thousands in 2006) are net of $1,763,519 thousands ($1,594,557 thousands in 2006) remitted in monthly installments to the department of Finance on the basis of a remittance schedule set by the department of Finance. The amounts remitted represent the participating provinces’ share of the HST collected by the Agency under the terms of the Comprehensive Integrated Tax Coordination Agreement (CITCA).
5. Excise Duties
Excise duties include duties assessed against imported goods, including alcohol and tobacco. During the 2006-2007 fiscal year, a significant increase in the volume of imported goods subject to such duties resulted in an increase in excise duty revenues of $815,657 million.6. Accounts Receivable and Advances
The following table presents details of the accounts receivable and advances:
| 2007 | 2006 | |
|---|---|---|
|
(in thousands of dollars)
|
||
| Receivables from other Federal Government departments and agencies | 12,905 | 4,147 |
| Receivables from external parties | 3,650 | 3,199 |
| Employee advances and other receivables | 1,510 | 1,254 |
| 18,065 | 8,600 | |
| Less: allowance for doubtful accounts on external receivables |
(621)
|
(520)
|
| Total | 17,444 |
8,080
|
7. Tax Receivables
Tax receivables represent the customs duties, excise taxes, Goods and Services and the Harmonized Sales taxes due to the Receiver General for Canada as a result of importations into Canada.
The following table presents details of tax receivables:
| 2007 | 2006 | |
|---|---|---|
|
(in thousands of dollars)
|
||
| Tax receivables |
1,450,393
|
1,403,291
|
|
|
|
|
| Less: allowance for doubtful accounts |
(155,351)
|
(231,832)
|
|
|
|
|
| Net tax receivables |
1,295,042
|
1,171,459
|
8. Tangible Capital Assets
(in thousands of dollars)
| Cost | Accumulated amortization | |||||||||
|---|---|---|---|---|---|---|---|---|---|---|
| Capital asset class | Opening Balance |
Acquisi- tions |
Transfers Disposals write-offs and other | Closing balance |
Opening balance | Amorti-zation | Transfers, disposals write-offs and other |
Closing balance |
2007 Net book value |
2006 Net book value |
| Land |
4,402
|
3
|
(3)
|
4,402
|
-
|
-
|
-
|
-
|
4,402
|
4,402
|
| Buildings |
138,277
|
3,955
|
-
|
142,232
|
40,980
|
4,594
|
-
|
45,574
|
96,658
|
97,297
|
| Works and infrastructure |
1,124
|
-
|
-
|
1,124
|
313
|
22
|
-
|
335
|
789
|
811
|
| Machinery and Equipment |
56,924
|
4,275
|
2,633
|
63,832
|
21,230
|
5,508
|
524
|
27,262
|
36,570
|
35,694
|
| Information technology equipment, in house developed and purchased software |
106,099
|
743
|
15,946
|
122,788
|
34,033
|
14,942
|
44
|
49,019
|
73,769
|
72,066
|
| Vehicles |
24,220
|
1,420
|
(1,292)
|
24,348
|
16,304
|
3,365
|
(1,309)
|
18,360
|
5,988
|
7,916
|
| Assets under construction |
74,246
|
29,814
|
(9,907)
|
94,153
|
-
|
-
|
-
|
-
|
94,153
|
74,246
|
| Total |
405,292
|
40,210
|
7,377
|
452,879
|
112,860
|
28,431
|
(741)
|
140,550
|
312,329
|
292,432
|
9. Accounts Payable and Accrued Liabilities
The following table presents details of the accounts payables and accrued liabilities:
| 2007 | 2006 | |
|---|---|---|
|
(in thousands of dollars)
|
||
| Payables to external parties |
45,088
|
38,142
|
|
|
|
|
| Payables to other Federal Government Departments and agencies |
48,948
|
49,795
|
|
|
|
|
| Total |
94,036
|
87,937
|
10. Payable to Provinces
A number of Memorandums of Understanding (MOUs) have been established between the provinces and the Agency, whereby the Agency collects provincial sales, alcohol and tobacco taxes on behalf of the provinces and remits these collections directly to the provinces monthly in compliance with the strict timelines set out in the MOUs.
| Opening Balance | Receipts from taxpayers | Refunds to taxpayers | Payments to provinces | Closing Balance | |
|---|---|---|---|---|---|
|
(in thousands of dollars)
|
|||||
| Payable to provinces |
7,569
|
78,779
|
(1,578)
|
(76,528)
|
8,242
|
11. Deposit accounts
The deposit accounts were established to record cash and securities required to guarantee payment of customs duties and excise taxes on imported goods pursuant to the Customs Act and the Excise Tax Act and to guarantee the compliance of transporters and individuals with the provisions of the Immigration and Refugee Protection Act.
| Opening Balance | Receipts | Payments | Closing Balance | |
|---|---|---|---|---|
|
(in thousands of dollars)
|
||||
| Guarantee deposit accounts |
35,329
|
14,524
|
(13,605)
|
36,248
|
| Seized cash |
4
|
-
|
(4)
|
-
|
| Other deposit accounts |
4,337
|
300
|
(62)
|
4,575
|
|
39,670
|
14,824
|
(13,671)
|
40,823
|
|
12. Employee severance benefits
(a) Pension benefits: The Agency’s employees participate in the Public Service Superannuation Plan, which is sponsored and administered by the Government of Canada. Pension benefits accrue up to a maximum period of 35 years at a rate of 2 percent per year of pensionable service, times the average of the best five consecutive years of earnings. The benefits are integrated with the Canada/Qu�bec Pension Plans benefits and they are indexed for inflation. Both the employees and the Agency contribute to the cost of the Plan. Actuarial surpluses or deficiencies are recognized in the financial statements of the Government of Canada, as the Plan’s sponsor.
(b) Severance benefits: The Agency provides severance benefits to its employees based on eligibility, years of service and final salary. These severance benefits are not pre-funded. Benefits will be paid from future appropriations. Information about the severance benefits, measured as at March 31, is as follows:
| 2007 | 2006 | |
|---|---|---|
|
(in thousands of dollars)
|
||
|
Accrued benefit obligation, beginning of year
|
118,288
|
87,361
|
|
Expense for the year
|
59,390
|
40,642
|
|
Benefits paid during the year
|
(9,617)
|
(9,715)
|
|
Accrued benefit obligation, end of year
|
168,061
|
118,288
|
13. Contingent liabilities
(a) Contaminated sites
Liabilities are accrued to record the estimated costs related to the management and remediation of contaminated sites where the Agency is obligated or likely to be obligated to incur such costs. The Agency identified 1 site in 2007 (2 sites in 2006) where such action is possible and for which a liability of $0.87 million in 2007 ($0.9 million in 2006) has been recorded. The
Agency’s ongoing efforts to assess contaminated sites may result in additional environmental liabilities related to newly identified sites, or changes in the assessments or intended use of existing sites. These liabilities will be accrued in the year in which they become known.
(b) Claims and litigation
Claims have been made against the Agency in the normal course of operations. Legal proceedings for claims totalling approximately $191 million ($195 million in 2006) were still pending as at March 31, 2007. In addition, appeals for previously assessed customs duties, excise duties, Goods and Services and Harmonized sales taxes have been received in the amount of $76 million ($272 million in 2006).
Some of these claims and appeals may become actual liabilities when one or more future events occur or fail to occur. To the extent that the future event is likely to occur or fail to occur, and a reasonable estimate of the loss can be made, an estimated liability and expense are recorded in the financial statements. As at March 31, 2007 the Agency has recorded an estimated liability of $.29 million ($1.2 million in 2006) in relation to claims and appeals.
14. Contractual Obligations
The nature of the Agency’s activities results in large multi-year contracts and obligations whereby the Agency will be committed to make future payments when the services are received. Significant contractual obligation that can be reasonably estimated is as follows:
| 2008 | 2009 | 2010 | 2011 | 2012 and there- after |
Total | |
|---|---|---|---|---|---|---|
|
(in thousands of dollars)
|
||||||
|
Operating lease
|
25,000
|
4,000
|
-
|
-
|
-
|
29,000
|
15. Related Party Transactions
The Agency is related in terms of common ownership to all Government of Canada departments, agencies and Crown corporations. The Agency enters into transactions with these entities in the normal course of business and on normal trade terms. Also during the year, the department received services, which were obtained without charge from other departments as presented in part.
(a) Services provided without charge:
During the year, the Agency received without charge from other departments, accommodation, legal fees, workers compensation coverage and the employer’s contribution to the health and dental insurance plans. These services without charge have been recognized in the Agency’s Statement of Financial Position as follows:
| 2007 | 2006 | |
|---|---|---|
|
(in thousands of dollars)
|
||
|
Accommodation
|
52,062
|
49,400
|
|
Employer’s contribution to the health
and dental insurance plans |
62,388
|
58,703
|
|
Worker's compensation coverage
|
452
|
420
|
|
Legal services
|
4,398
|
3,162
|
|
119,300
|
111,685
|
|
The Government has structured some of its administrative activities for efficiency and cost-effectiveness such that one department performs these on behalf of all without charge. The costs of these services, which include payroll and cheque issuance services provided by Public Works and Government Services Canada are not included as an expense in the Agency’s Statement of Operations.
(b) Administration of programs:
The Agency has arrangements with the Canada Revenue Agency for the provision of information technology services, which are paid for on a quarterly basis (Total of $97,406,000 paid in 2007 and $90,730,000 in 2006). Information Technology Services provided include:
- Infrastructure Administration and services
- Architecture and Consulting Services; and
- Regional Services
16. Comparative information
Comparative figures have been reclassified to conform to the current year’s presentation.
Table 10: Response to Parliamentary Committees, Audits and Evaluations
|
Response to Parliamentary Committees |
|---|
|
None requested in 2006–2007 |
|
Response to the Auditor General (including to the Commissioner of the Environment and Sustainable Development) |
|---|
|
Proper Conduct of Public Business — Public Safety Agencies This audit examined key aspects of the proper conduct of public business in three agencies: the RCMP, Correctional Service Canada and the Canada Border Services Agency. It looked at whether each agency has values and ethics programs that promote good behaviour and internal disclosure (“whistle-blowing”) policies that support the reporting of wrongdoing. It also examined the role that internal audit plays in verifying compliance with laws, policies and regulations. The audit also looked at three areas where a risk of abuse is present: contracting, use of acquisition (credit) cards and use of overtime and leave. The full report including recommendations and action plans can be found on the Office of the Auditor General of Canada’s Web site at www.oag-bvg.gc.ca/domino/reports.nsf/html/20061104ce.html. |
|
External Audits |
|---|
|
The Office of the Privacy Commissioner of Canada conducted the Audit of the Personal Information Management Practices of the Canada Border Services Agency — Trans-Border Data Flows. This audit examined the extent to which the CBSA is adequately controlling and protecting the flow of Canadians’ personal information to foreign governments or their institutions. The audit found that significant opportunities exist to better manage privacy risks and achieve greater accountability, transparency and control over the transborder flow of data:
The CBSA will develop various action plans to ensure that the transborder flow of personal information is protected, that the Canadian public’s concerns are dealt with and that the collection of information is accurate. The full report including the recommendations and action plans can be found on the Office of the Privacy Commissioner of Canada’s Web Site at www.privcom.gc.ca/information/pub/ar-vr/cbsa_060620_e.asp. |
|
Internal Audits |
|---|
|
Three internal audits were completed in 2006–2007: Audit of Cash Management Overall, the audit noted that compliance with the laws, regulations, policies and procedures governing the control of cash needed some improvement. A framework is in place for cash management that is made up of a series of policies, procedures, directives and guidelines. However, these policies and procedures were not up to date or consolidated for easy reference. The audit found a lack of compliance with policies and procedures. Weaknesses were noted regarding supervision, segregation of duties and safeguarding of monetary assets. Management did not always review operations regularly to ensure that control deficiencies were detected and corrected. As well, management at headquarters did not communicate monitoring expectations. Management has taken action to address all the recommendations. Audit of the 2005-2006 Year-End Cash Cut-Off Procedures The audit concluded that the year-end procedures for the 2005–2006 fiscal year were followed and that cash in transit was reported in a satisfactory manner. With respect to procedures, it was noted that the CBSA still relied on the year-end procedures of the Canada Revenue Agency, which did not fully document the situation at the CBSA. As well, errors were identified with the recording of the date of receipt, which has implications on whether the funds are recorded as cash or accounts receivable on the Agency’s financial statements. An action plan was developed to address all the recommendations. Appropriate actions have been put in place to minimize errors and improve operational requirements. Audit of IT Systems under Development — Phase 1 The audit concluded that a management control framework for the development of automated business systems is in place; however, opportunities exist to strengthen the framework, thereby ensuring adequate governance, risk management and control over systems under development projects. A number of strengths in the controls over IT systems under development were noted and can provide the Agency with the foundation for building a strong management control framework. Areas that could be strengthened include the following:
Management has taken action to address all the recommendations and the recommendations should be fully implemented by September 2007. |
|
Evaluations |
|---|
|
Two program evaluations were completed in 2006–2007: Detector Dog Service — Evaluation Study The Detector Dog Service (DDS) evaluation study found that the program continues to be a relevant CBSA program and is fully aligned with the Government of Canada and the CBSA’s mandate. Detector dogs are a powerful tool against the entry of prohibited, controlled or regulated goods and undeclared currency, and they are an effective complement to the various detection technologies and officer enforcement training that the CBSA is also using in its efforts to combat criminality at the border. A significant finding was that the DDS program cuts across several CBSA branches and there was no clearly defined management framework guiding the roles and responsibilities of those delivering the program in the Detector Dog Learning Service, the Enforcement Branch, the Operations Branch and the regions. Therefore, a recommendation was made to fully develop, implement and communicate a management framework for the program. The report also recommended that food, plant and animal (FPA) detector dog teams be quickly integrated into the DDS program by ensuring that the FPA detector dog handlers report to the same superintendent as other handlers to the extent possible. In addition, the report recommended that an awareness package be developed for wide CBSA distribution on the program’s benefits, contribution and importance. Other issues and related recommendations pertain to the implementation of a comprehensive and robust annual risk-assessment process to ensure maximum coverage of detector dog teams at high-risk ports, including an assessment of regional needs for additional teams. Finally, the report recommended enhancing the monitoring, analysis and reporting of program performance by integrating the DDS program’s databases to facilitate historical reporting and analysis, and to eliminate current inconsistencies. The CBSA is taking action to address the recommendations in the evaluation report so that it can continue to build on the significant success of this program and further improve its delivery and effectiveness. Partners in Protection Evaluation Study
|
Table 11: Horizontal Initiatives
In 2006–2007, the CBSA was a partner in the following horizontal initiatives:
- 2010 Winter Olympic and Paralympic Games — Delivering on our Commitments
(www.tbs-sct.gc.ca/rma/eppi-ibdrp/hrdb-rhbd/olym-olym/description_e.asp)
Lead: Canadian Heritage - National Initiative to Combat Money Laundering
(www.tbs-sct.gc.ca/rma/eppi-ibdrp/hrdb-rhbd/nicml-inlba/description_e.asp)
Lead: Department of Finance - Canada’s Drug Strategy
(www.tbs-sct.gc.ca/rma/eppi-ibdrp/hrdb-rhbd/cds-sca/description_e.asp)
Lead: Health Canada - Federal Tobacco Control Strategy
(www.tbs-sct.gc.ca/rma/eppi-ibdrp/hrdb-rhbd/ftcs-sflct/description_e.asp)
Lead: Health Canada - Canadian Firearms Program
(www.tbs-sct.gc.ca/rma/eppi-ibdrp/hrdb-rhbd/cfp-pcaf/description_e.asp)
Lead: RCMP - Marine Security
(www.tbs-sct.gc.ca/rma/eppi-ibdrp/hrdb-rhbd/ms-sm/description_e.asp)
Lead: Transport Canada - Asia-Pacific Gateway and Corridor Initiative
(www.tc.gc.ca/majorissues/APGCI/menu.htm)
Lead: Transport Canada and Foreign Affairs and International Trade Canada
Table 12: Travel Policies
The CBSA follows and uses the Treasury Board of Canada Secretariat’s Special Travel Authorities and Travel Directive.
The Special Travel Authorities (www.tbs-sct.gc.ca/Pubs_pol/hrpubs/TBM_113/STA_e.asp) outline travel provisions for ministers and their exempt staff, as well as members of Parliament, deputy ministers, Governor-in-Council appointees and executives. The authority also outlines the principles guiding heads of departments in the exercise of discretion concerning their business travel expenses.
The Travel Directive (www.tbs-sct.gc.ca/pubs_pol/hrpubs/TBM_113/td-dv_e.asp) and the rates and allowances (www.tbs-sct.gc.ca/pubs_pol/hrpubs/TBM_113/menu-travel-voyage_e.asp) serve as a benchmark for the Special Travel Authorities and apply to public service employees, exempt staff and other persons travelling on official government business.
More information on travel policies can be found on the TBS Web site at http://www.tbs-sct.gc.ca/rma/dpr3/06-07/index_e.asp.
Additional Information
- Policy on service standards for external fees
(www.tbs-sct.gc.ca/rma/dpr3/06-07/index_e.asp) - Details on project spending
(www.tbs-sct.gc.ca/rma/dpr3/06-07/index_e.asp) - Supplementary information on major Crown projects
(www.tbs-sct.gc.ca/rma/dpr3/06-07/index_e.asp) - Procurement and contracting
(http://www.tbs-sct.gc.ca/rma/dpr3/06-07/index_e.asp) - Horizontal initiatives
(www.tbs-sct.gc.ca/rma/eppi-ibdrp/hrdb-rhbd/profil_e.asp) - Storage tanks
(www.tbs-sct.gc.ca/rma/dpr3/06-07/index_e.asp)